
Figure 7.
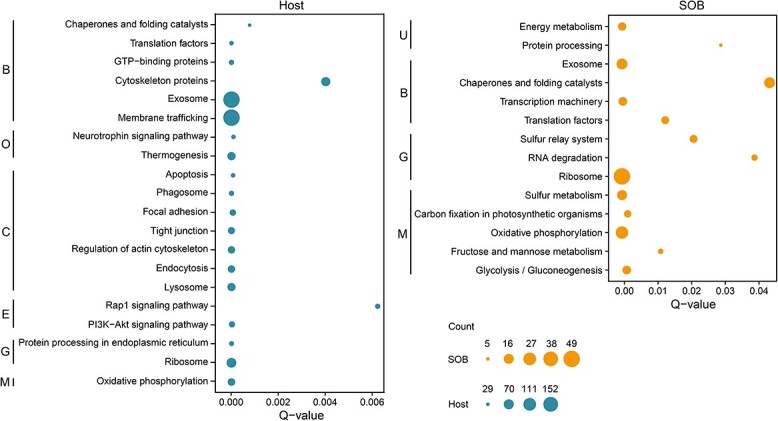
Functional enrichment of highly expressed genes (HEGs) in the gill of host and ectosymbiont. Only pathways with a Q-value <0.05 were considered significant. Only the top 20 abundant pathways of the host were presented (Table S11). The count refers to the number of genes in each category. B: Brite hierarchies; C: Cellular processes; E: Environmental information processing; G: Genetic information processing; M: Metabolism; O: Organismal systems; U: Unclassified.