
FIGURE 4.
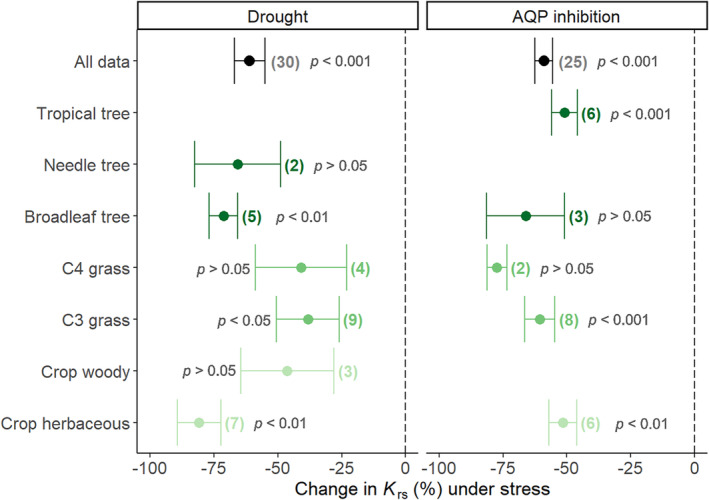
Response of K rs to stress treatments. Changes in K rs under drought stress (left panel) and aquaporin inhibition (right panel). Data points and error bars represent the mean ± the standard error for each PFT (sample size n reported on the side). The mean value for all samples is represented with a black circle. Individual values were calculated based on the log response ratio. The p‐values correspond to one‐sample t‐tests for all data and the individual PFTs.