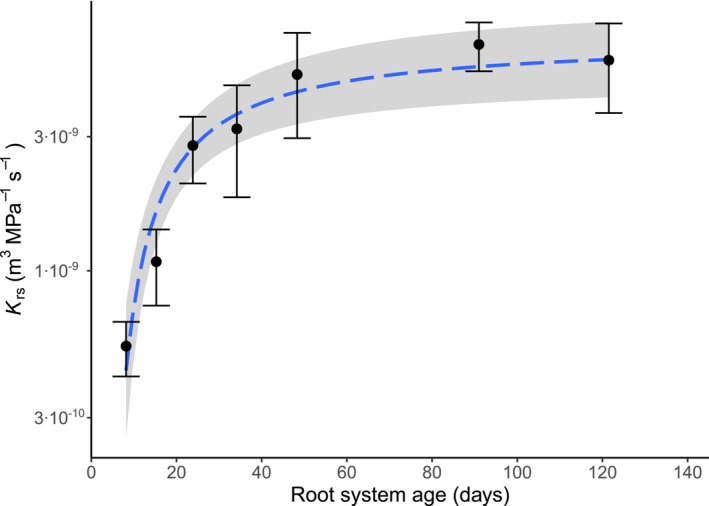
FIGURE 5.

Relationship between root system age and K rs in crop species. Data points and error bars represent K rs (mean ± standard error) of crop species (C3 and C4 grasses and dicot crops) grouped according to age (0–10, 10–20, 20–30, 30–40, 40–60, 60–100, >100 days). The dashed blue line and the shaded area represent a fitted exponential model (± standard error).
