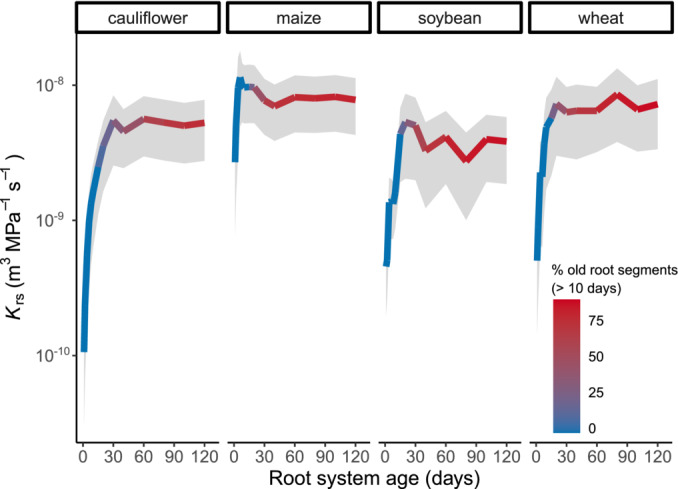
FIGURE 6.

Modeled K rs development with age in crop species. Colored lines and shaded areas represent K rs (mean ± standard error) of simulations using CPlantBox coupled with MARSHAL, for four different crops: cauliflower (forb), maize (C4 grass), soybean (legume) and wheat (C3 grass). The species were selected based on plant‐functional diversity. The color scale indicates the proportion of old (>10 days) root segments in the total root system.
