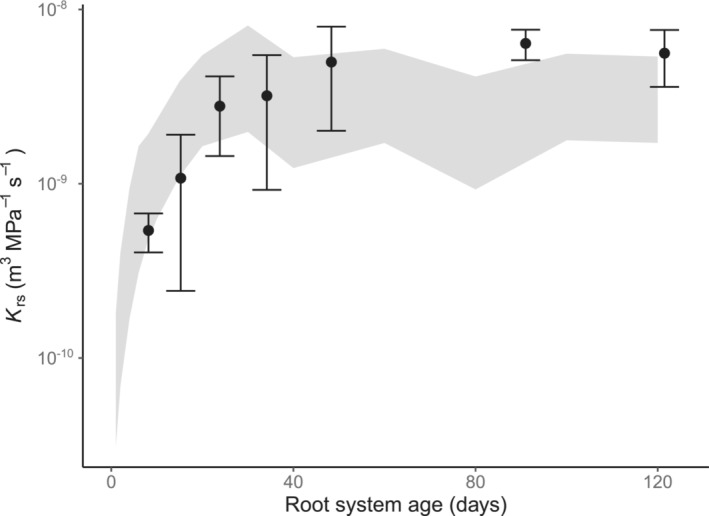
FIGURE 7.

Modeled and observed K rs development with age in crop species. Data points and error bars represent K rs (mean ± standard error) of crop species (C3 and C4 grasses and dicot crops) from the review and the shadowed area represents the total range of variation in K rs according to simulations (CPlantBox coupled with MARSHAL using four crop species).
