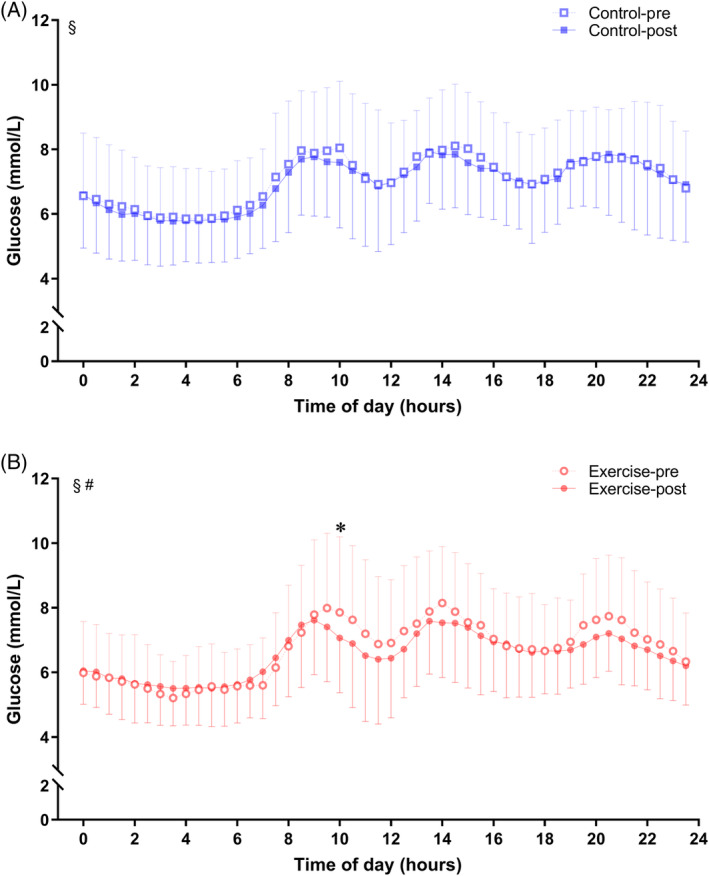
FIGURE 2.

FGM‐based glucose levels in response to study intervention. FGM‐based glucose levels were assessed before and during the intervention. A, Blue lines and symbols, control group (n = 25); B, red lines and symbols, exercise group (n = 25). Using two‐way repeated‐measures analysis of variance: § p < .05 for the effect of time; # p < .05 for the interaction between study intervention and time. Using Bonferroni's multiple comparison test: *p < .05 for the difference between pre and post period in each group. Values are mean ± SD. FGM, flash continuous glucose monitor.
