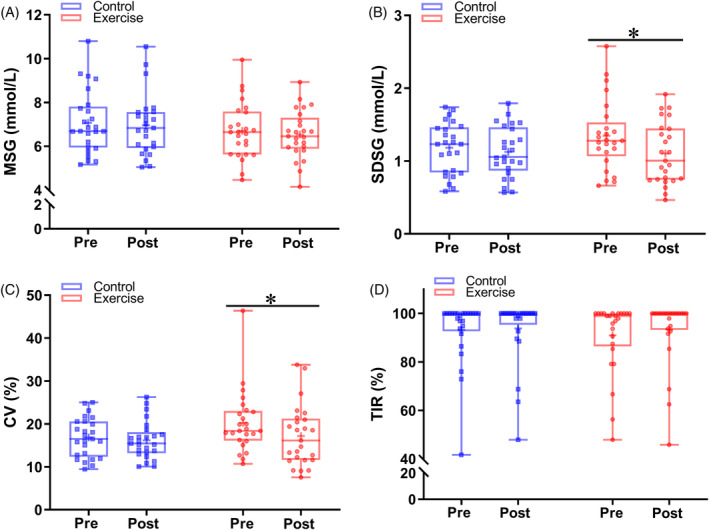
FIGURE 3.

Comparison of glycemic variability indexes between control and exercise group. (A) MSG, (B) SDSG, (C) CV, and (D) TIR levels between pre and post period in the control and exercise groups. Blue lines and symbols, control group (n = 25); red lines and symbols, exercise group (n = 25). *p < .05 for the difference between pre and post period in each group. CV, coefficient of variation; MSG, mean sensor glucose; SDSG, SD of sensor glucose; TIR, time in range.
