
Fig. 3. Static in-vitro biofilm formation by single and total S. epidermidis psm mutants.
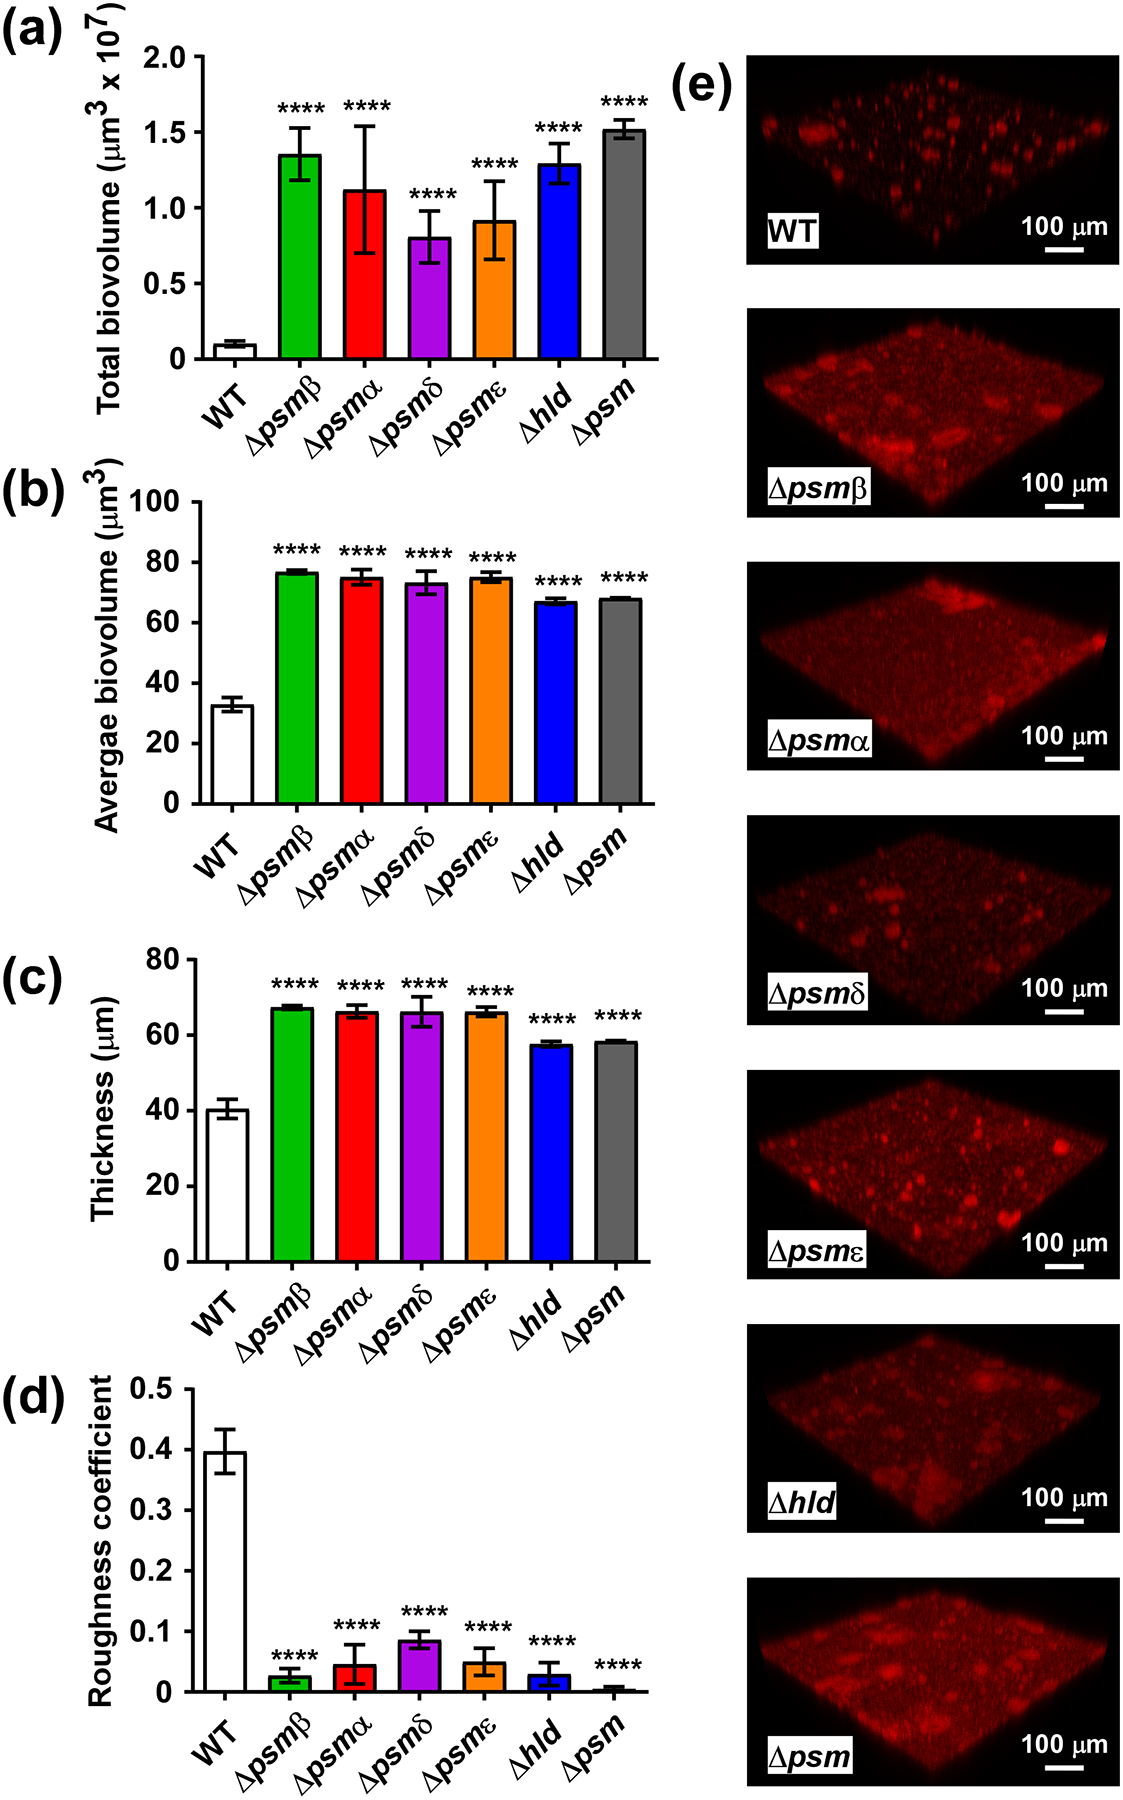
Biofilms were grown in TSBg in static mode for 48 h, measured by CLSM, and analyzed by Imaris or Comstat software. In addition to psm mutants, an isogenic mutant of the quorum-sensing psm control system agr was measured. (a) Total biovolumes (total biofilm mass). (b) Average biovolumes (More compact biofilm have higher; biofilms with more channel formation lower values.) (c) Thickness. (d) Roughness coefficient (Biofilms that are smoother have a lower value.) (e) Representative CLSM example pictures. (a-d) ****, p<0.0001 [1-way ANOVA with Dunnett’s post-test versus data obtained with the wild-type (WT) strain]. Data are from n=16 measurements of randomly selected areas in a sample. The experiment was repeated with similar results.