
Fig. 4. Dynamic in-vitro biofilm formation by wild-type and isogenic Δpsm mutants strains.
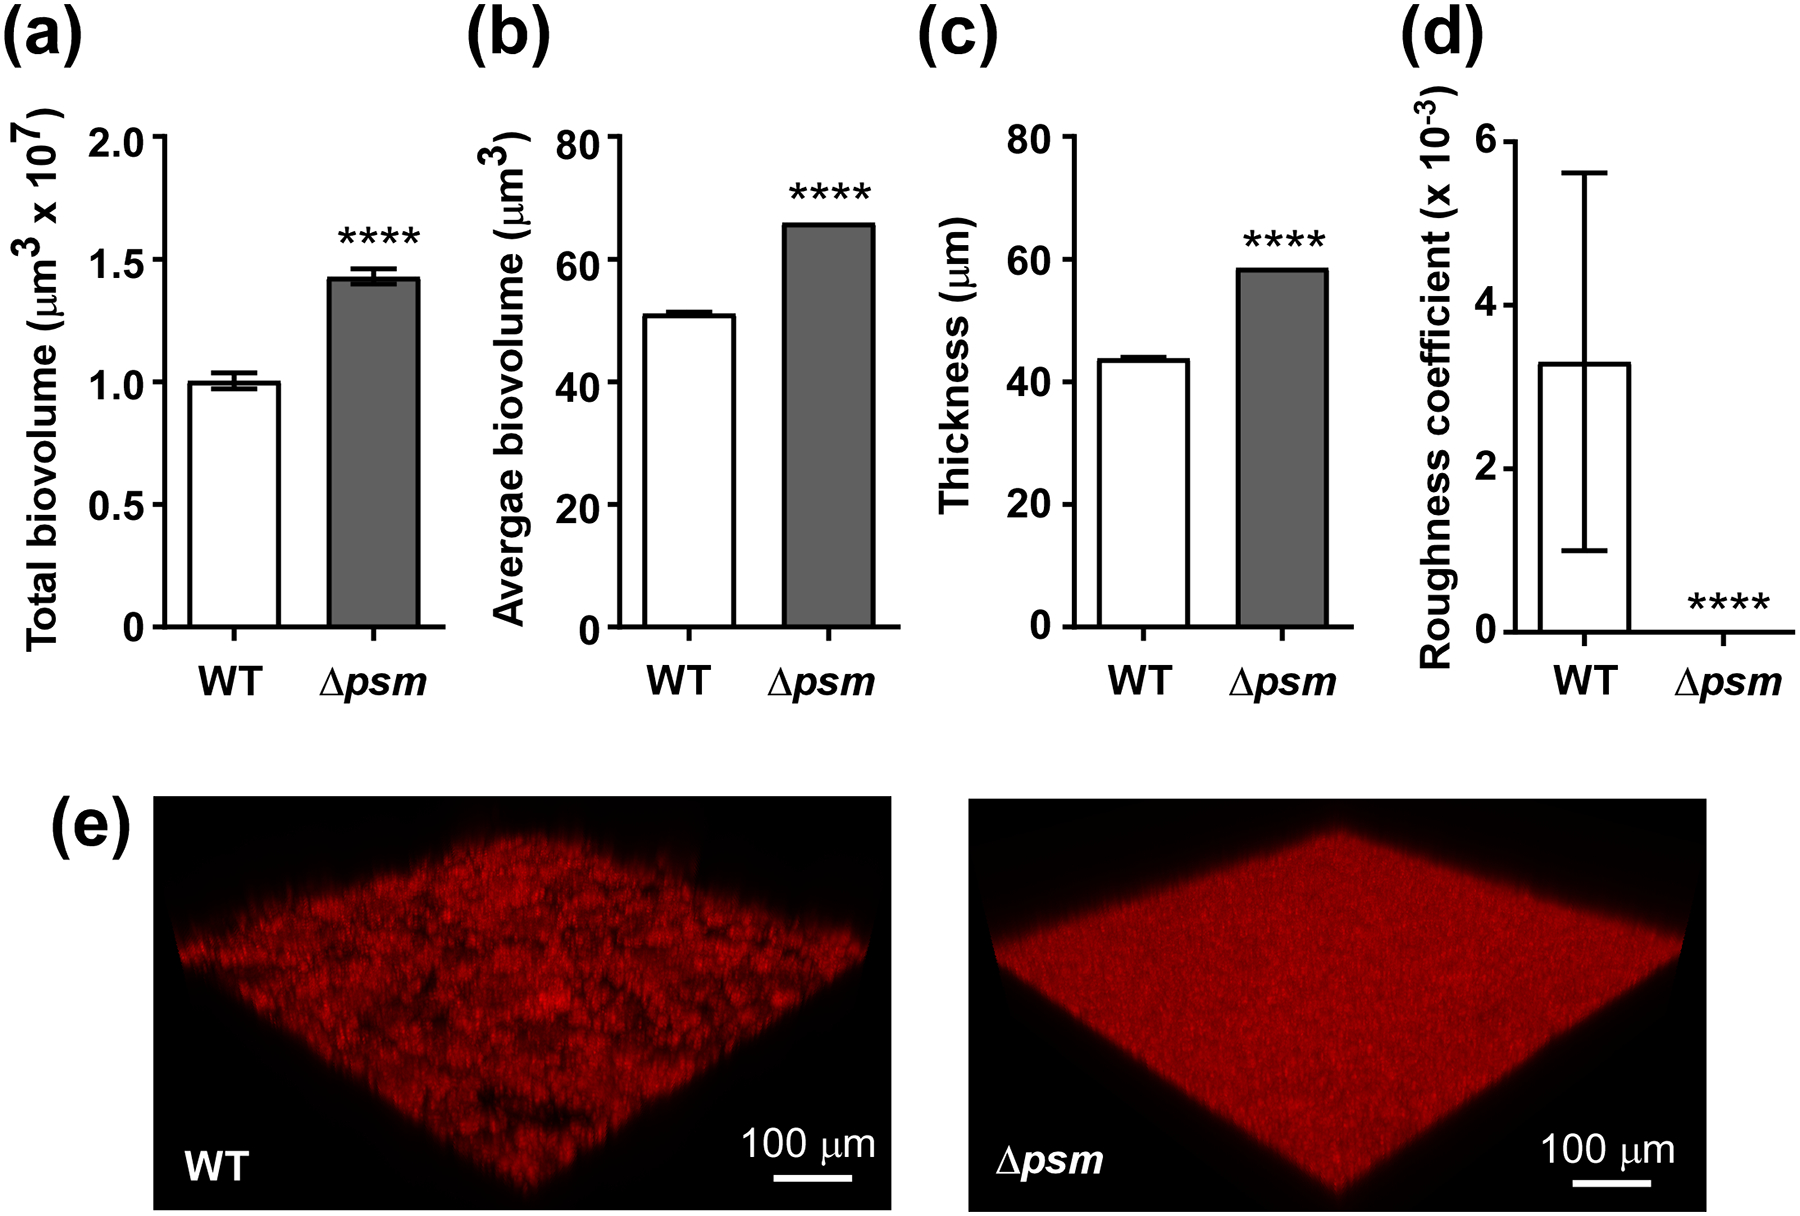
Biofilms were grown in TSBg in dynamic mode in flow cells for 48 h, measured by CLSM, and analyzed by Imaris or Comstat software. (a) Total biovolumes (total biofilm mass). (b) Average biovolumes (More compact biofilm have higher; biofilms with more channel formation lower values.) (c) Thickness. (d) Roughness coefficient (Biofilms that are smoother have a lower value.) (e) Representative CLSM example pictures. (a-d) ****, p<0.0001 (unpaired t-tests). Data are from n=15 measurements of randomly selected areas in a sample. The experiment was repeated with similar results.