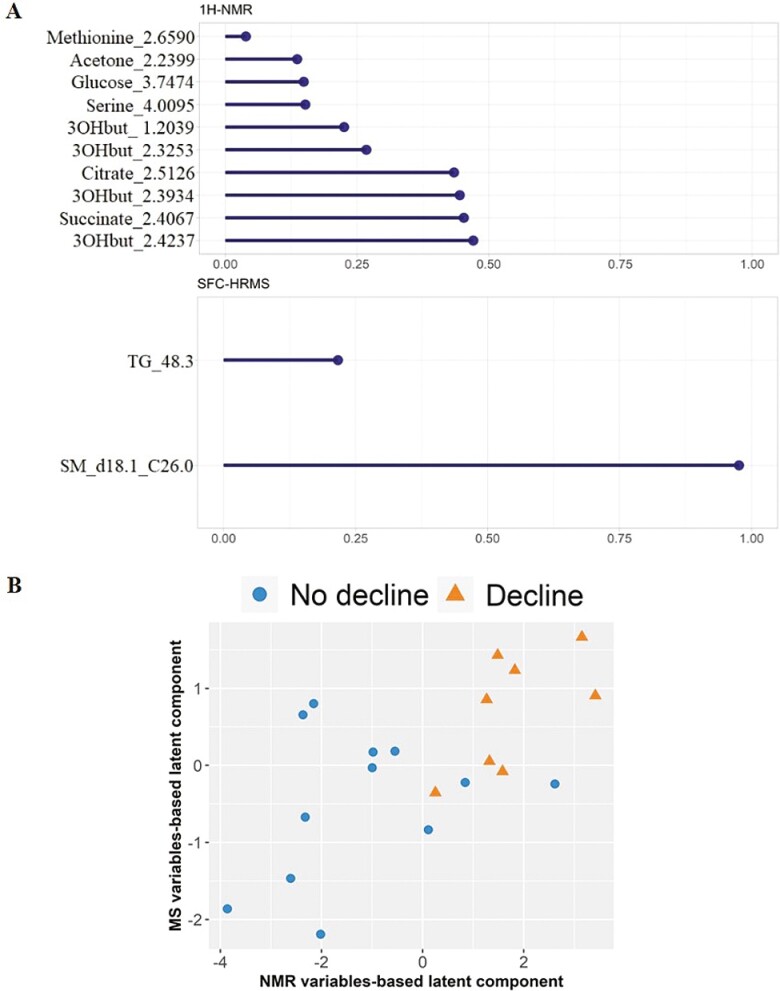
Figure 1.
A totsl of 9 metabolites across the NMR and SFC-HRMS data sets together predict cognitive decline. (A) Variable importance plots for the cognitive decline metabolome and lipidome biomarker panel. The most important variables (according to the absolute value of their coefficients) are ordered. Absolute loading plot for the 1H-NMR (top) and SFC-MS (bottom) variables selected by multiblock sPLS-DA (DIABLO) performed on the MAPT study (non-decliner and decliner patients). The most important variables (according to the absolute value of their coefficients) are ordered from bottom to top. (B) Score plot from multiblock sPLS-DA. Samples are represented based on the specified component (here 1 latent component). Samples are colored by decline status. 3OHbut: 3-hydroxybutyrate; TG: Triglyceride; SM: Sphingomyelin.

