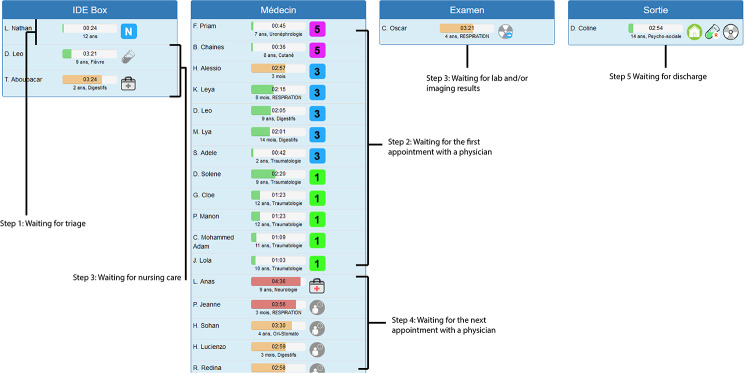
Fig. 1.
The Optimum software’s interface and annotations on its use. The colored status bar next to the patient’s name corresponds to the LOS in the PED. The status bar’s color depends on the patient’s LOS, relative to that of patients admitted for the same reasons. The bar is green when the patient’s LOS is below the 50th percentile but changes to yellow when the LOS is between the 50th and 75th percentiles, to red when the LOS is between the 75th and 95th percentiles, and lastly to dark red (overcrowding) when LOS is greater than the 95th percentile. Once the PED is overcrowded, the priority is discharging patients rather than seeing new ones

