
Fig. 1. SARS-CoV-2 detection and host gene expression in COVID-19 lung autopsy samples.
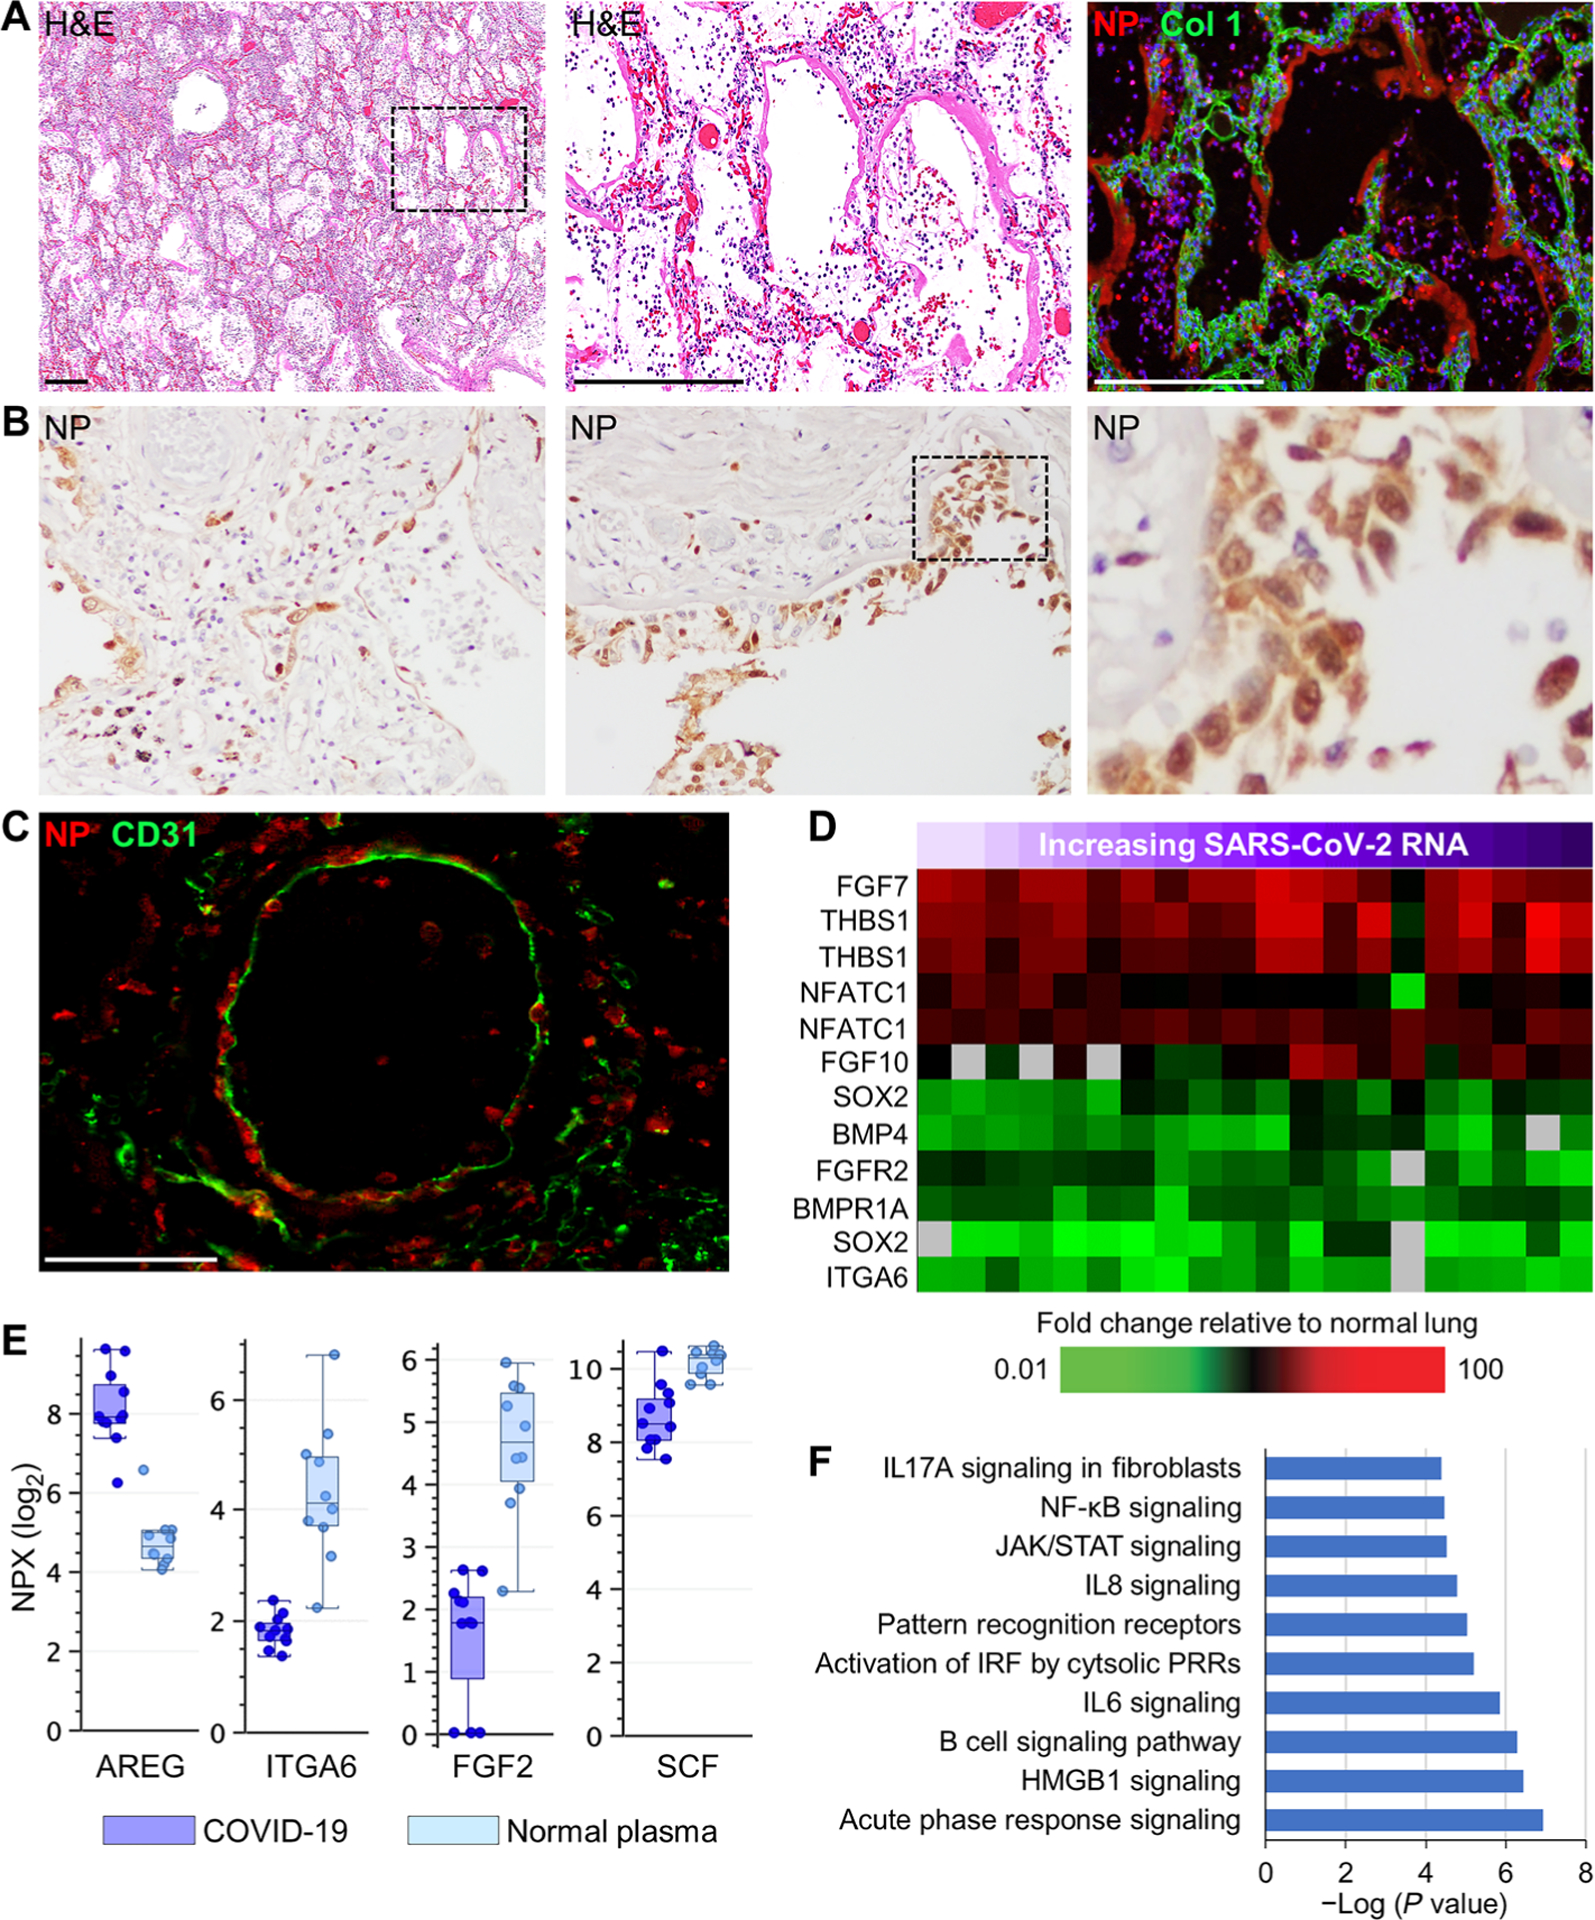
(A) Shown are representative images from serial lung autopsy sections from a patient with COVID-19 with acute DAD (case 1). Sections were stained with H&E or immunostained for the SARS-CoV-2 nucleocapsid antigen (NP) and collagen type 1 (Col 1). The digitally magnified boxed area shows marked NP immunoreactivity in hyaline membranes lining alveoli and intra-alveolar epithelial debris and cellular infiltrates. Nuclei were counterstained with Hoechst 33342 dye (blue). (B) Representative images of NP immunohistochemistry show positive staining in bronchiolar epithelium, epithelial basal cells, and alveolar epithelium (case 2). Black dashed box shows area of digital enlargement. Original magnification, ×200. (C) Immunofluorescence image of a medium-sized blood vessel stained for NP and endothelial CD31 (case 7). (D) Heatmap shows expression of genes encoding lung repair–related proteins in lung tissue from 13 COVID-19 cases (table S5). Each column represents gene expression data from a microarray experiment comparing RNA from COVID-19 lung tissue to pooled RNA isolated from normal lung tissue (n = 3). Genes shown in red were significantly increased (twofold, P < 0.05, using standard t test with Benjamini-Hochberg correction), genes shown in green were decreased, and genes in black indicate no change in expression in COVID-19 lung tissue relative to normal lung tissue. An increase in SARS-CoV-2 RNA in lung tissue is indicated by a purple gradient bar with values ranging from 0 to 44.9. Viral CT values were normalized to the calibrator gene GAPDH, and final CT values were inverted (40 − Δt) such that a higher value represents a higher viral load. (E) Basal cell and lung repair–related proteins in plasma from patients with COVID-19 (n = 6) and healthy volunteers (n = 10) were measured by the Olink platform. Values were statistically significant (P < 0.05) between the groups using standard t test with Benjamini-Hochberg correction. Scale of normalized protein expression (NPX) is log2. Each circle represents an individual plasma sample, and 25th, median, and 75th quartiles are indicated with box-and-whisker plots. SCF, stem cell factor. (F) Shown is a gene ontology analysis of transcripts with expression correlating (R ≥ 0.6) with pulmonary SARS-CoV-2 RNA levels. Scale bars, 250 μm (A) and 100 μm (C). NF-κB, nuclear factor κB; JAK, Janus kinase; STAT, signal transducer and activator of transcription; IRF, IFN regulatory factor.