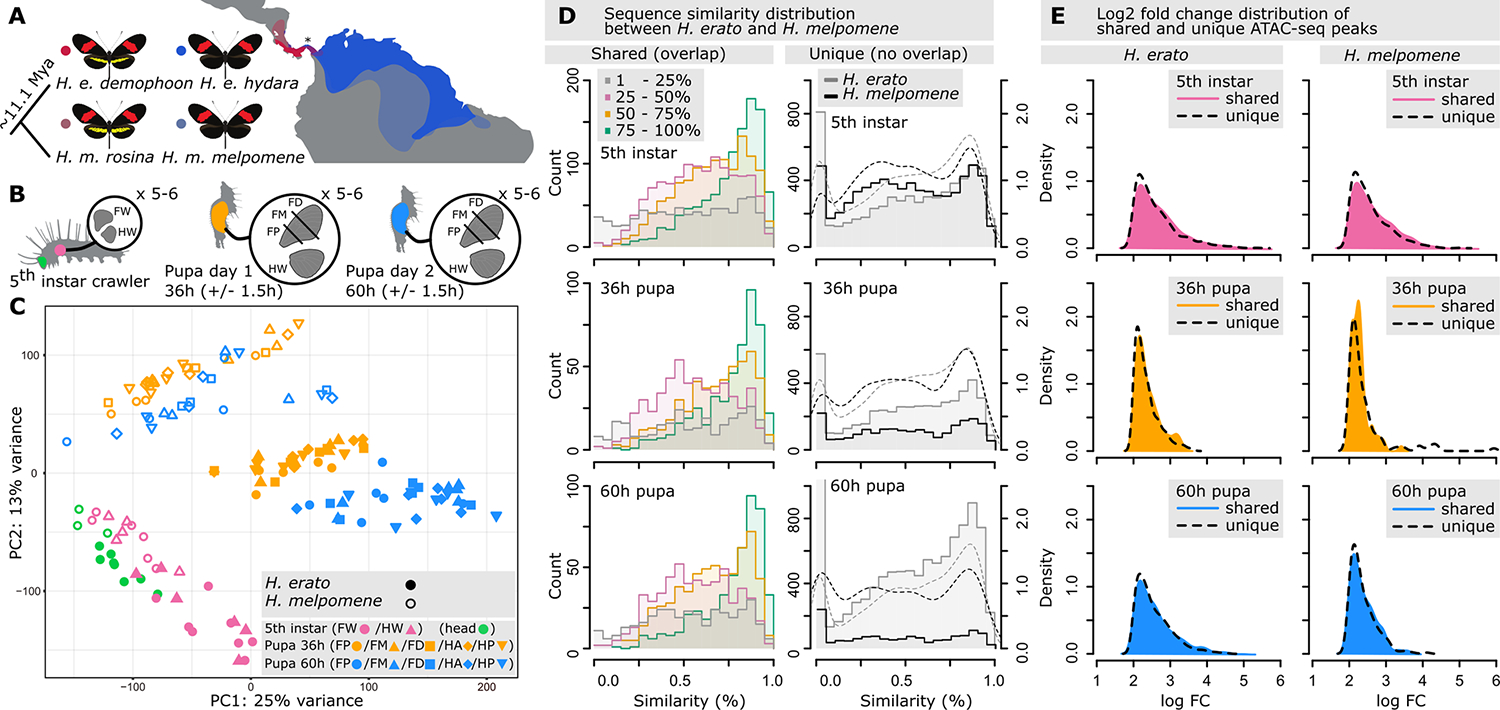
Fig. 1. Sampling of chromatin accessibility (ATAC-seq) data and architecture of specific and shared chromatin landscape between H. erato and H. melpomene.

(A) Geographic distribution of red-banded H. erato and H. melpomene postman morphs used in this study. The populations of H. erato demophoon and H. melpomene rosina have a red forewing band and a yellow hindwing bar and admix with, respectively, H. erato hydara and H. melpomene melpomene that lacks the yellow hindwing bar. Samples come from reared morphs of Panama indicated with an asterisk (*). (B) Tissue sampling of fifth-instar head, forewing (FW), and hindwing (HW), and 36-hour pupal (day 1) and 60-hour pupal (day 2) FW sections (FP, FW posterior; FM, FW medial; FD, FW distal) and HW. (C) Principal components analysis (PCA) of ATAC-seq count values for peaks with at least 25% overlap between species. (D) Sequence similarity distribution between H. erato and H. melpomene for shared (left, ≥1-bp overlap, with overlapping ranges investigated at 25% intervals) and specific (right, 0-bp overlap) ATAC-seq peaks. Dashed lines indicate density distributions. (E) Log2-fold changes of shared (colored) and specific (dashed lines) ATAC-seq peaks that were differentially more accessible at a developmental time point in H. erato and H. melpomene.
