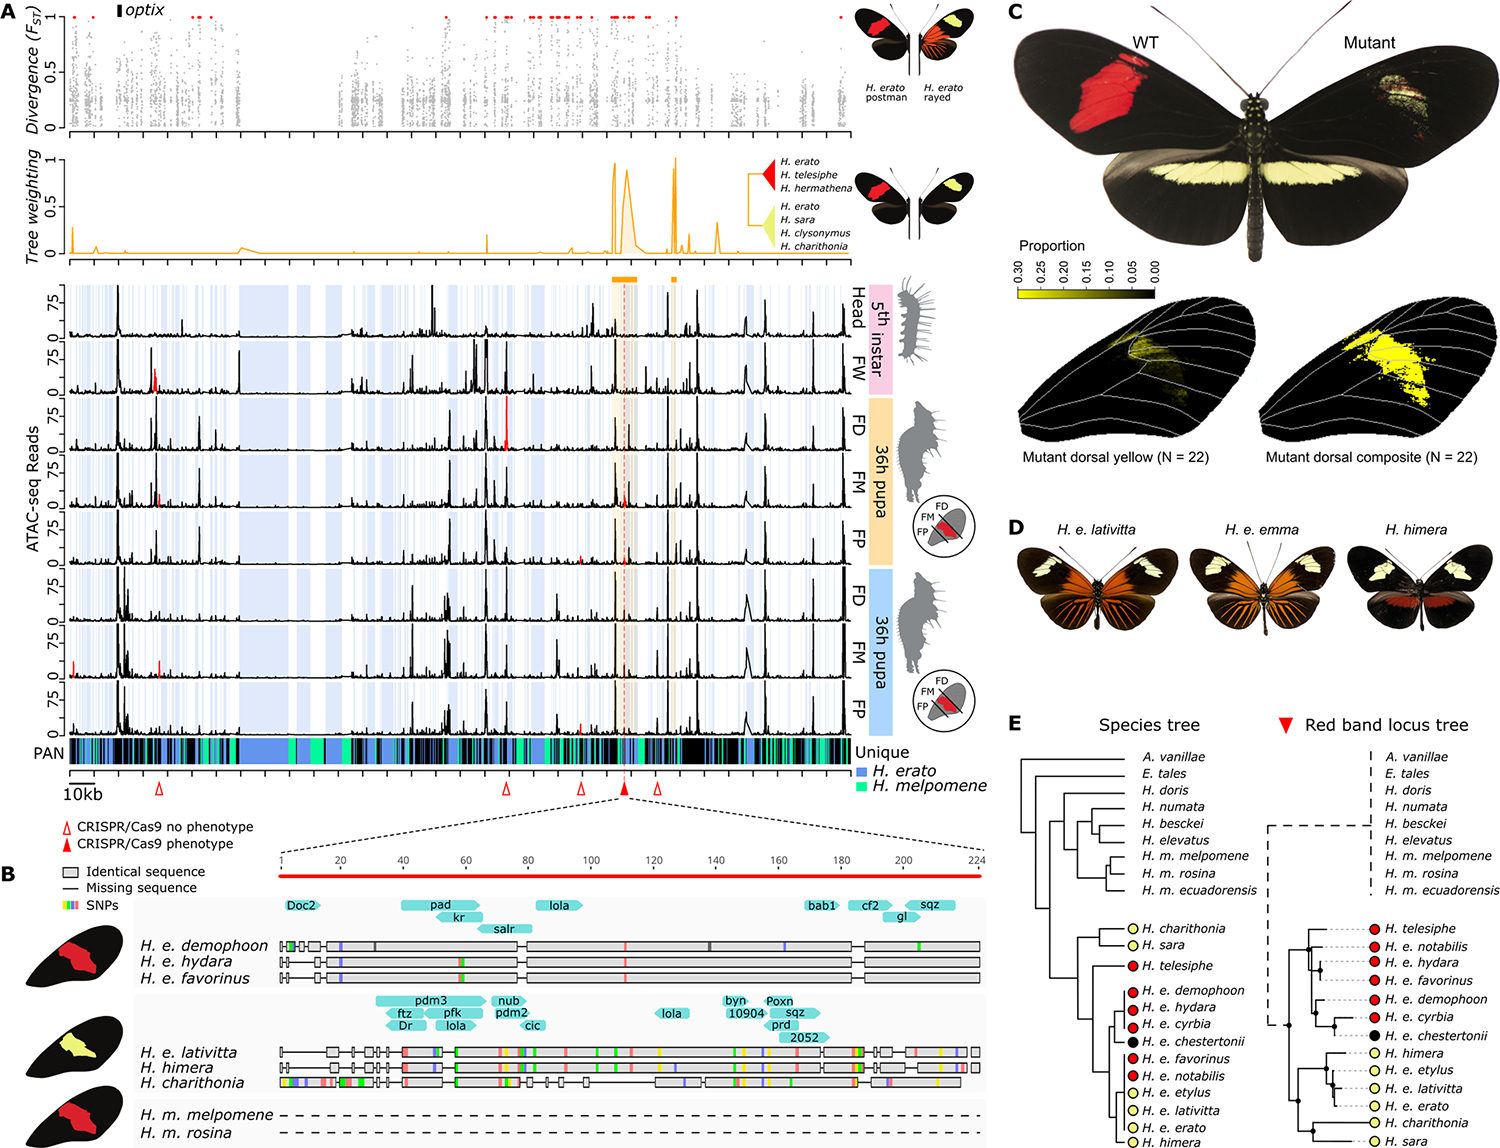
Fig. 4. Key regulatory switch of red forewing band development.

(A) Divergence [Fixation index (FST)], phylogenetic association (tree weighting), and ATAC-seq profile of red FW band near the optix gene. Blue shading indicates sequence that is specific to H. erato compared with H. melpomene. Red triangles indicate CRISPR-Cas9 excision targets. The solid red triangle indicates the target for which loss of red scales and gain of yellow scales in the FM section were observed. (B) Zoom-in on the only differentially accessible peak near optix associated with red forewing band. Gray bars and colors indicate aligned nucleotides and single-nucleotide polymorphisms (SNPs), respectively, whereas horizontal lines represent gaps. Blue arrows indicate in silico TF binding sites specific to each haplotype. The dashed lines indicate complete absence of homologous sequence. (C) CRISPR-Cas9 KO phenotype of key regulatory switch. Because of the mosaicism of CRISPR-Cas9 mutants, the complete color pattern transition is represented by the composite analysis of the individual mutant wing phenotypes. (D) Examples of geographic morphs with yellow forewing band phenotypes. (E) Detail of phylogeny of red (red circles) versus yellow (yellow circles) forewing band phenotypes at the key regulatory optix switch. The dashed branch for the outgroup species and H. melpomene indicates complete absence of homologous sequence.
