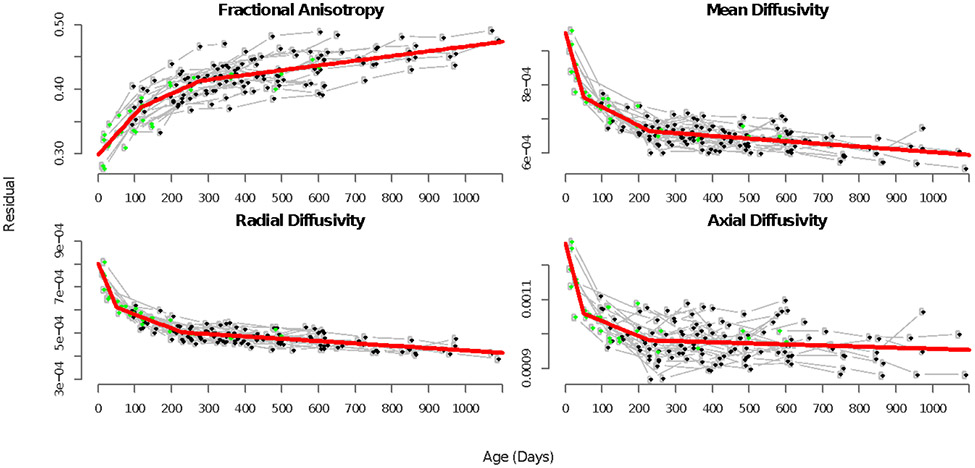
Figure 3:
The final model fit using the optimized knots for the inferior longitudinal fasciculus. The first scan for each individual is shown in green. Subsequent scans are shown in black and are traced with gray lines. Age (in days) is the x-axis, and FA, MD, RD, or AD on the y-axis. The final two-knot model (normalized anesthesia is ignored for this plot) is shown in red and captures developmental trajectories well. For all tracts see Figure S3

