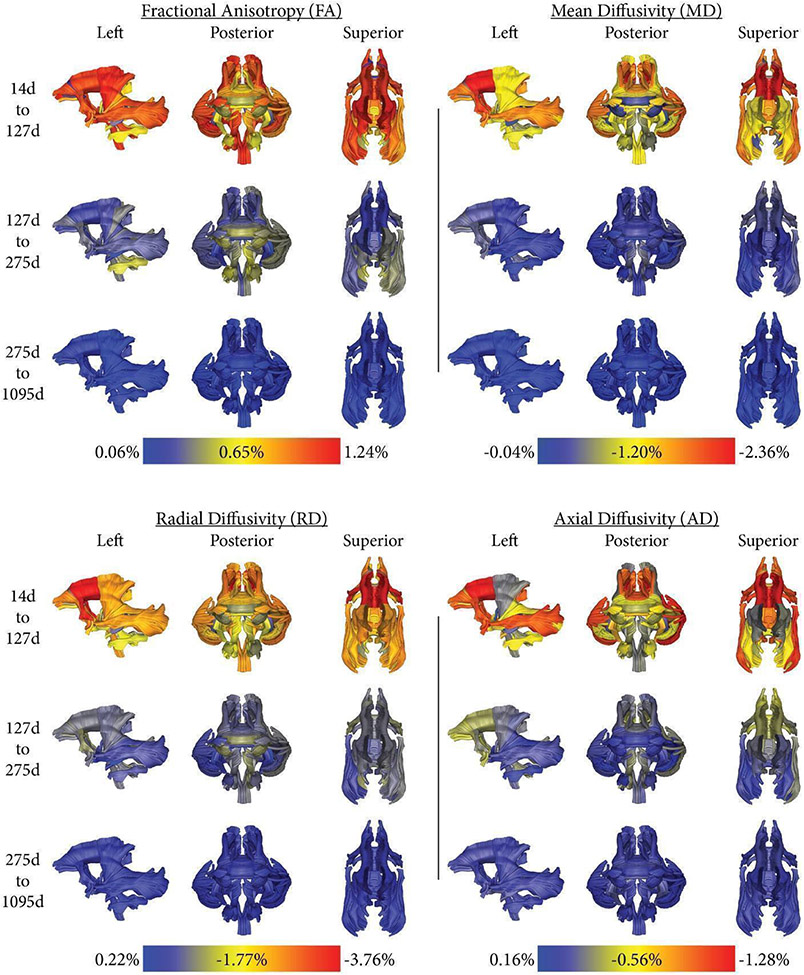
Figure 4:
The average rate of change of FA, MD, RD, or AD (per week), normalized as a percentage of the final model’s FA, MD, RD, or AD value at 1,095 days with no anesthesia exposures, is shown for various periods in days. 14d was chosen to be the start point as it was the earliest time scan, 1095d was the latest. 127 days was the average of the first knot for FA, 275d the average of the second knot for FA. Please note, that each diffusion property has a different color map scale to provide an equal visualization range, FA increases with age, and RD, AD, and MD decreases.

