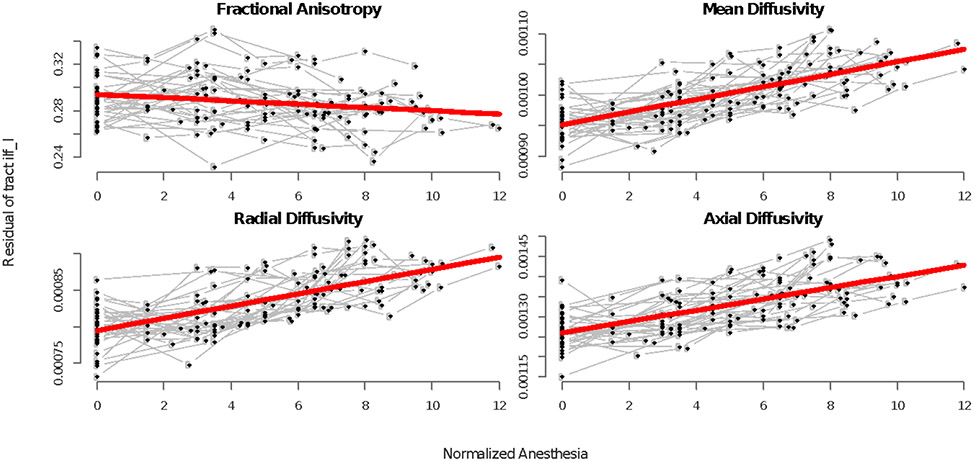
Figure 5:
Scans for each individual are shown in black and traced with gray lines. Normalized anesthesia is on the x-axis and residuals are on the y-axis. The final longitudinal model for overall anesthesia exposure after removing the effects of age is shown in red and captures the cumulative effect of anesthesia on the inferior longitudinal fasciculus. See supplemental for all tracts (Figure S4).

