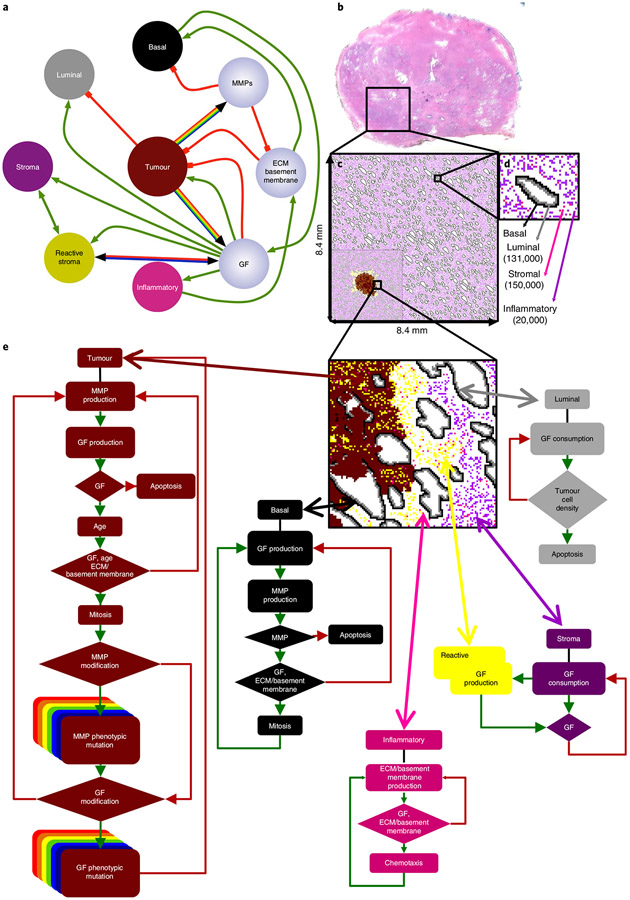
Fig. 1 ∣. In silico multiscale model of the prostate peripheral zone.
a, Interaction network of key model variables. Interactions between cells (coloured nodes) and microenvironmental variables (lilac nodes) are represented as either green (positive) or red (negative) connections. Multicoloured connectivity represents the spectrum of possible tumour phenotypes with different levels of growth factor and MMP production. Bicoloured connectivity represents two different degrees of stromal reactivity. b-d, In silico reconstruction of the normal prostate peripheral zone tissue. b, Histopathological slide of the whole normal prostate, highlighting the peripheral zone, filled with epithelial acini surrounded by stroma (magenta). c, In silico representation of the complete peripheral zone, including ductal structures and cellular densities that mimic normal anatomy. This constitutes the domain where all simulations were performed. The inset on the bottom left is an example of a sample simulation d, Representation of a single reconstructed duct and the surrounding stroma, as well as the total number of cell types. e, Cell decision flow charts for each cell type in the model. The phenotypic behaviour of an individual cell is based on the interaction between the cell and the local microenvironment. GF, growth factor.

