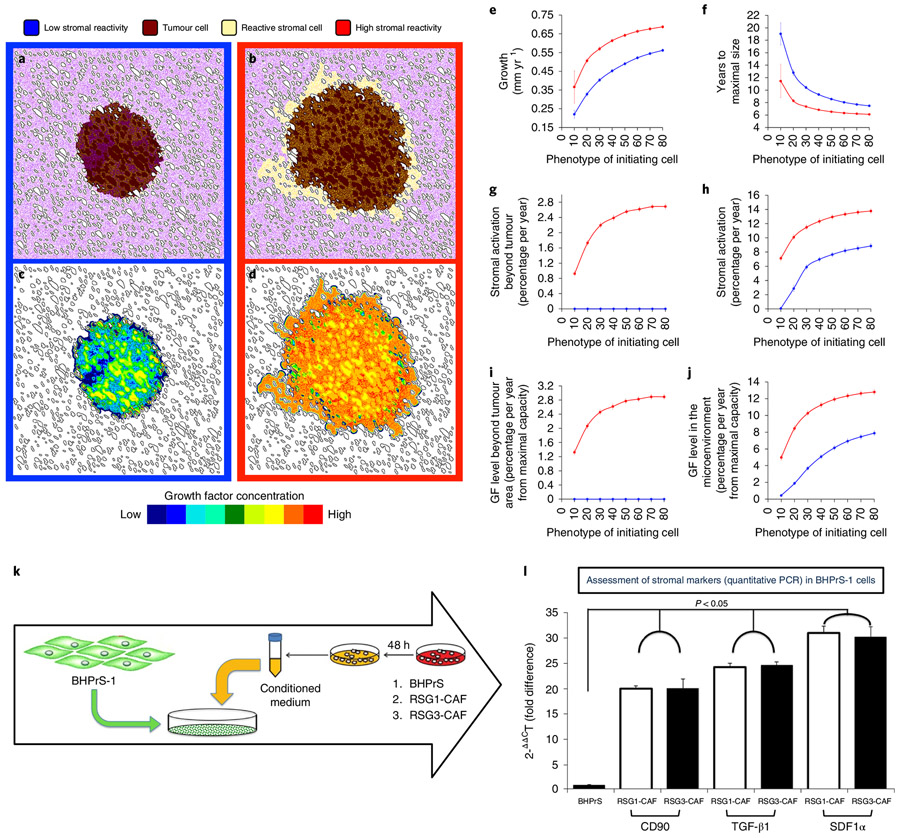
Fig. 2 ∣. Change in stromal reactivity phenotypes, tumour growth and invasiveness.
a-d, Six years of simulated tumour growth, initialized with a tumour cell producing low levels of growth factors (20% of the maximal simulated cell production capacity) under two different microenvironmental conditions: low stromal reactivity (a,c, blue frames and lines) or high stromal reactivity (b,d, red frames and lines). a and b show tumour cell spatial distribution (brown) with normal stroma (purple) and reactive stroma (yellow); c and d show the resulting spatial distributions of growth factor concentration for tumours a and b, respectively. e-j, Different tumour metric distributions over eight initiating phenotypes (ranging from 10% to 80% of the maximal simulated cell growth factor production capacity) in high (red) and low (blue) stromal reactivity environments averaged over 100 simulations per phenotype (error bars represent mean ± s.d.). e, Average growth of the tumour. f, Time to achieve maximal size (reach the edge of the tissue domain). g,h, Percentage of stromal activation within (g) and beyond (h) the tumour varied with the phenotype of the tumour-initiating cells and with the stromal reactivity. i,j, The concentration of growth factor found in the microenvironment beyond (i) and within (j) the tumour parallels stromal activation. k, To assess the ability of reactive stroma to activate benign stroma cells, the human prostate stromal cell line BHPrS1 was cultured in the presence of conditioned medium from either BHPrS1, RSG1-CAF or RSG3-CAF for 4 weeks. l, At the end of the experiment, expression of CD90, TGF-β1 and SDF1α (all putative activated stromal markers) was determined by quantitative PCR. Conditioned media from RSG1-CAF and RSG3-CAF elicited a similar and significant increase in the levels of these mRNAs compared to medium conditioned by the functionally normal BHPrS1 cell line. Relative levels of mRNA are shown compared to a control standardized to a mean value of one. Error bars represent s.d. In all three cases, the marker mRNAs are increased markedly by conditioned medium (P < 0.05; ANOVA) but there was no difference in effect between conditioned medium from RSG1- or RSG3-derived fibroblasts.

