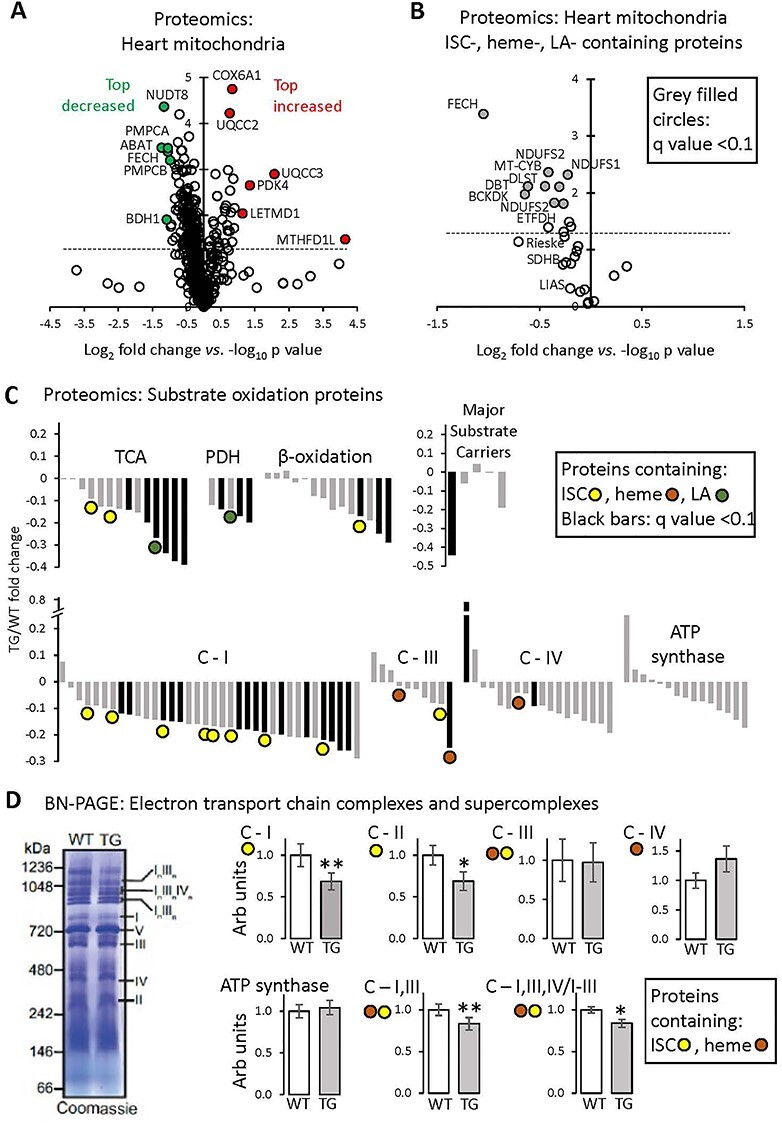
Figure 3 .

Proteomics analysis of heart mitochondria: variable effect of FXN depletion on ISC-containing proteins. All measurements were done in heart mitochondria from WT and TG mice fed Doxy diet for 18 weeks. (A) Volcano plot (log2 TG/WT-fold change versus log10 P-value, unpaired t-test) of heart mitochondrial proteins determined by mass spectroscopy (n = 3/genotype). Inclusion criteria: proteins identification on the basis of more than one peptide in at least one genotype. Dashed line: P = 0.05 (unpaired t-test). (B) Volcano plot (log2 TG/WT-fold change versus log10 P-value, unpaired t-test) of heart mitochondrial proteins containing ISCs or heme or LA moieties. Proteins determined by mass spectroscopy (n = 3/genotype). Dashed line: P = 0.05 (unpaired t-test). Black-filled circles: proteins with q-value (P-value corrected for FDR) < 0.10. (C) Fold change of substrate oxidation-related proteins, determined by mass spectroscopy (n = 3/genotype). Black bars: proteins with q-value < 0.10. C-I, III, IV: Complexes I, III, IV of the ETC. Complex II subunits are included in the ‘TCA’ category. (D) BN-PAGE gel electrophoresis of isolated heart mitochondria, to reveal the abundance of ETC complexes and SCs. Left: Example of Coomassie-stained gel, with ETC complexes and SCs shown by Roman numerals. Right: Quantification; values are mean ± SEM (n = 5/genotype, *P < 0.05, **P < 0.01 by unpaired t-test).
