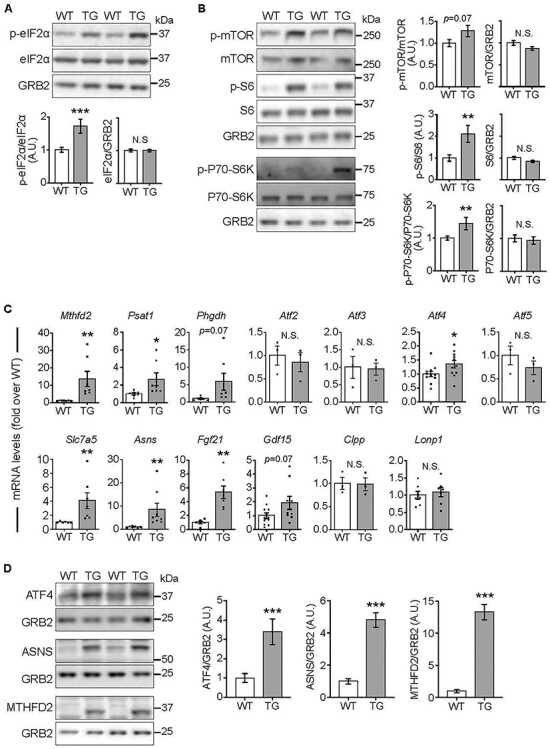
Figure 4 .

Elevated mTORC1 signaling and ISR activation in the heart after 18 weeks of FXN depletion. All measurements were done in heart lysates from WT and TG mice fed Doxy for 18 weeks. (A) Phosphorylation status of eIF2α. Top: Representative immunoblot of p-eIF2α(Ser52), total eIF2α and GRB2 from heart lysates of WT and TG mice. Lower: Quantification (n = 9 WT/7 TG). (B) mTORC1 signaling. Left: Representative immunoblots of p-mTORC1 (Ser2448), total mTOR, p-S6 (Ser235/236), total S6, p-P70-S6K (Thr389), total P70-S6K and GRB2 (loading control). Right: quantification (n = 9 WT/7 TG). (C) Transcripts levels [normalized to Actb (β-actin) and expressed relative to WT] of stress signaling targets. Points show values from each sample. Value = 1 means no change, (n = 3–11/genotype). (D) Protein levels of ATF4 and targets. Left: Representative immunoblots. GRB2 was used as loading control. Right: Quantification (n = 6/genotype). In all panels: bars represent mean ± SEM. Statistical comparison was by unpaired t-test, *P < 0.05, **P < 0.01, ***P < 0.01.
