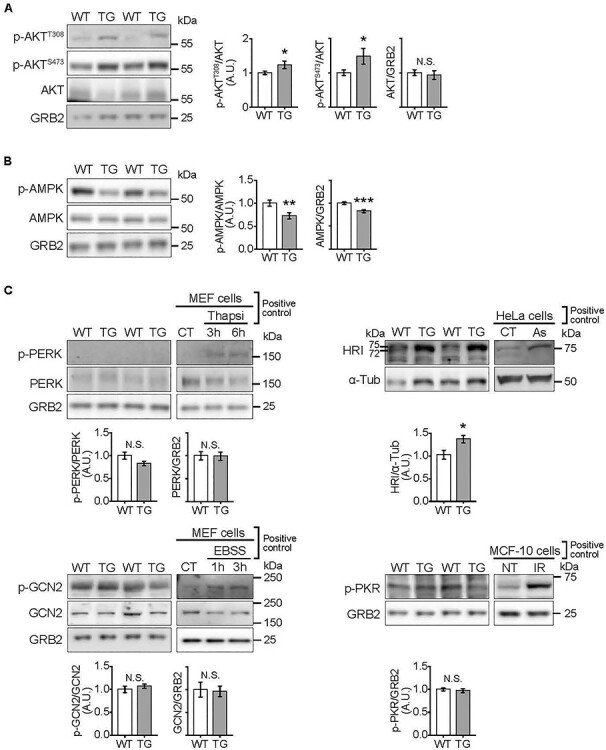
Figure 5 .

Altered activation of kinases upstream of eIF2α and mTORC1 in hearts depleted of FXN for 18 weeks. All measurements were done in heart lysates from WT and TG mice fed Doxy for 18 weeks. (A) AKT signaling. Left: Representative immunoblots of p-AKT (Ser473), p-AKT (Thr308), total AKT and GRB2 (loading control). Right: Quantification (n = 9 WT/7 TG). (B) AMPK signaling. Left: Representative immunoblots of p-AMPK (Thr302), total AMPK and GRB2 (loading control). Right panel: Averaged p-AMPK/AMPK, p-AMPK/GRB2 and AMPK/GRB2 values (n = 9 WT/7 TG). (C) Kinases upstream of eIF2α: PERK, GCN2, PKR and HRI. Representative immunoblots of p-PERK (Thr980), total PERK, p-GCN2 (Thr899) and total GCN2, HRI and p-PKR (Thr451), with GRB2 and α-Tubulin (α-Tub) as loading controls. Averaged p-PERK/PERK, p-GCN2/GCN2, HRI/(α-Tub) and pPKR/GRB2 values are shown below respective immunoblot. N = 4–9/genotype. Controls for antibodies: p-PERK: MEF treated with Thapsigargin 1 μM (Thapsi) to induce ER stress; p-GCN2: MEF cells cultured in EBSS to deprive cells of amino acids; p-PKR: MCF-10 cells were irradiated (20 Gy) to cause DNA damage to activate PKR (NT: non-treated, IR: irradiated); HRI: HeLa cells were incubated in 100 μM Na-Arsenite (As) for 1 h. All values are the mean ± SEM. Statistical comparison was by unpaired t-test, *P < 0.05, **P < 0.01, ***P < 0.001.
