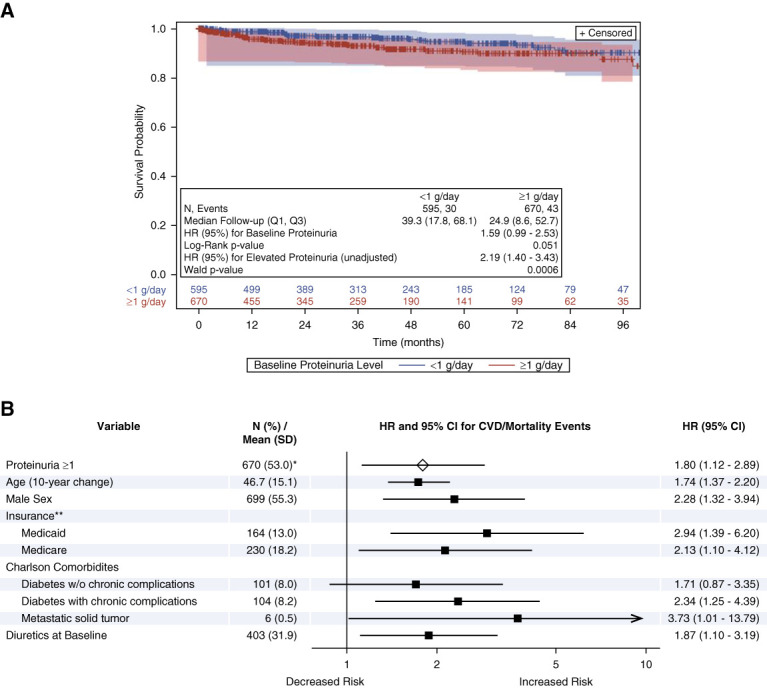
Figure 2.

Elevated proteinuria was associated with CVD/all-cause mortality events. Kaplan–Meier analysis (A) and Cox proportional model (B) results for proteinuria and CVD/mortality events. Log-rank P value from Kaplan–Meier analysis and HR (95% CI) in Kaplan–Meier plot from univariate Cox proportional hazards model. Forest plot generated from the multivariable Cox proportional hazards model. Arrow at the end of the CI bar for metastatic solid tumor indicates the upper end of the CI extends beyond the x axis. *N (%) at baseline. **Reference group=commercial and all other insurance. CI, confidence interval; HR, hazard ratio; Q1, first quartile; Q3, third quartile.
