. 2024 Jan 31;67(2):455–476. doi: 10.1044/2023_JSLHR-23-00280

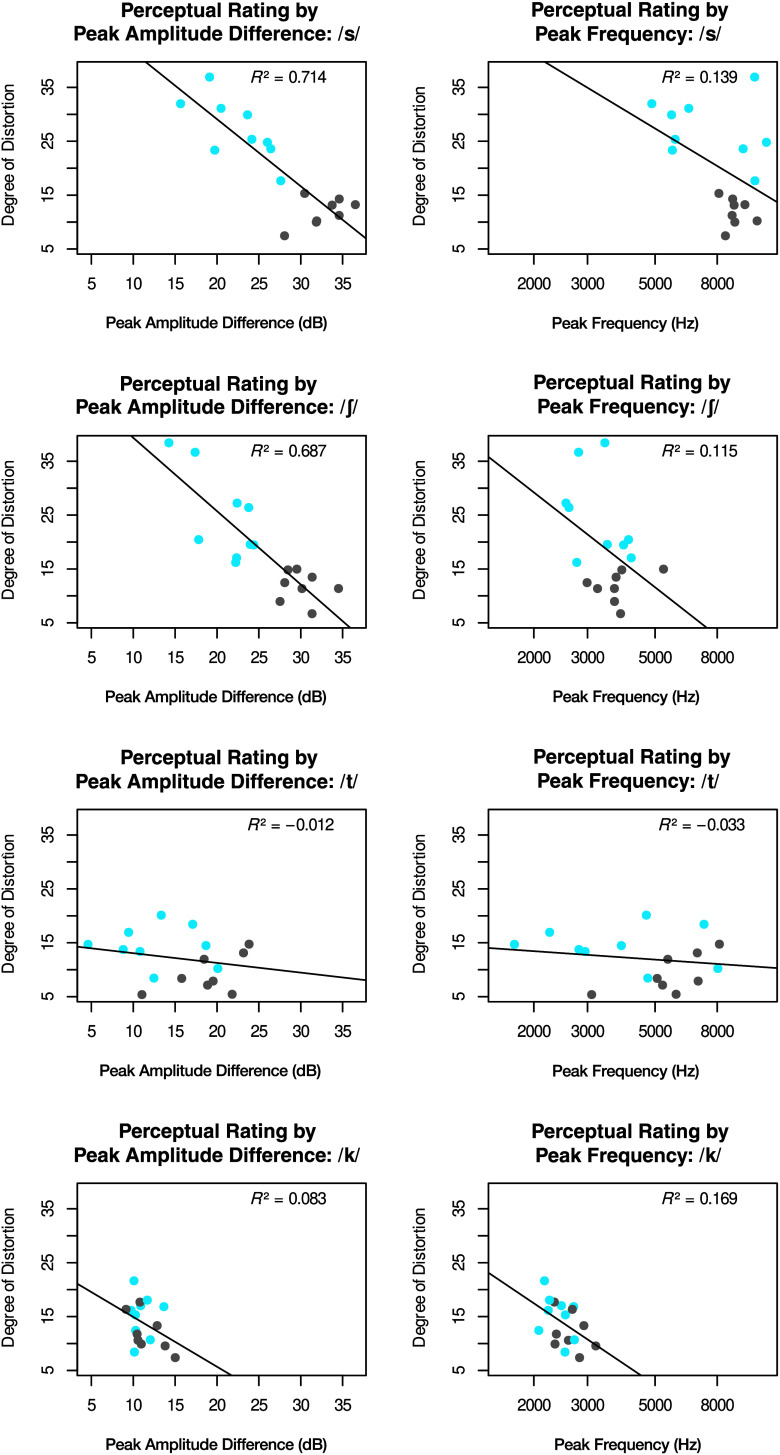
Figure 9.

8 scatterplots. In all the 8 scatterplots, the y axis represents the degree of distortion and it ranges from 5 to 35 in increments of 10. For the odd numbered plots, the x axis represents the peak amplitude difference in decibels and it ranges from 5 to 35 in increments of 5. For the even numbered plots, the x axis represents the peak frequency in hertz and it ranges from 2000 to 8000. Blue and grey data points are marked in each plot. Plot 1. The title of the plot is Perceptual rating by peak amplitude difference for s between forward slashes. A straight line runs between (12, 38) and (35, 10). The statistical parameter is R squared equals 0.714. Plot 2. The title of the plot is perceptual rating by peak frequency for s between forward slashes. A straight line runs between (2500, 38) and (10000, 15). The statistical parameter is R squared equals 0.139. Plot 3. The title of the plot is perceptual rating by peak amplitude difference for elongated s between forward slashes. A straight line runs between (12, 38) and (35, 5). The statistical parameter is R squared equals 0.687. Plot 4. The title of the plot is perceptual rating by peak frequency for elongated s between forward slashes. A straight line runs between (2000, 30) and (7500, 5). The statistical parameter is R squared equals 0.115. Plot 5. The title of the plot is perceptual rating by peak amplitude difference for t between forward slashes. A straight line runs between (5, 14) and (35, 10). The statistical parameter is R squared equals negative 0.012. Plot 6. The title of the plot is perceptual rating by peak frequency for t between forward slashes. A straight line runs between (2000, 13) and (8000, 16). The statistical parameter is R squared equals negative 0.033. Plot 7. The title of the plot is perceptual rating by peak amplitude difference for k between forward slashes. A straight line runs between (5, 20), and (21, 5). The statistical parameter is R squared equals 0.083. Plot 8. The title of the plot is perceptual rating by peak frequency for k between forward slashes. A straight line runs between (1000, 24) and (4500, 5). The statistical parameter is R squared equals 0.169. All values are estimates.

Comparison of perceptual measures of speech distortion versus peak amplitude difference and peak frequency for four consonants. Blue = Class III participants; gray = Class I control participants. The distortion scale ranges from 0 (completely clear) to 100 (severely distorted).