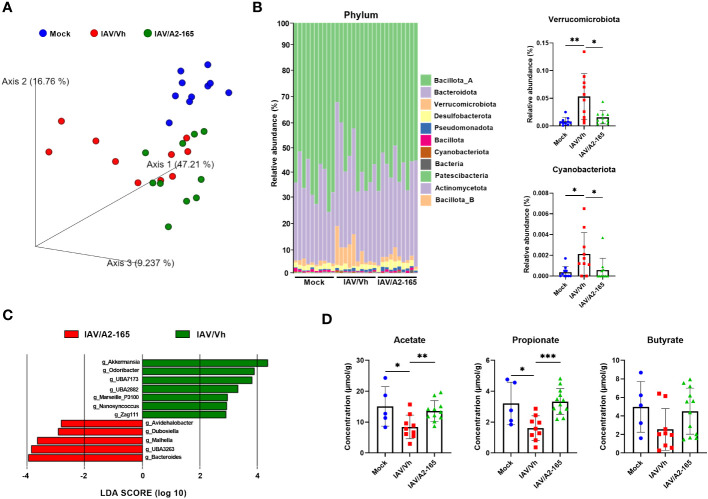
Figure 3.
Impact of F. duncaniae supplementation in IAV-infected mice on the production of SCFAs. (A) Seven days after IAV infection, fecal contents were collected for 16S rRNA profiling. Fecal samples from each mock-infected mouse were also collected. Bacterial communities were clustered using PCA of Weighted UniFrac distance matrices (beta diversity). The first three principal coordinates (PC1, PC2 and PC3) are plotted for each sample and the percentage variation in the plotted principal coordinates is indicated on the axes. Each spot represents one sample and each group of mice is denoted by a different color (blue: Mock-infected, red: IAV/Vh, green: IAV/A2-165). Distance between dots represents extent of compositional difference. (B) Left panel, Taxonomic (phylum) composition of the cecal microbiota. Right panel, the relative frequencies of Verrucomicrobiota and Cyanobacteriota are depicted. (C) LEfSe analysis indicating the most discriminant bacterial genus associated with changes in F duncaniae-treated mice. Only species with a statistically significant LDA score (log10) >2 (compared to vehicle) are shown. (A–C) (n = 10/group, one of two independent experiments shown). (D) Cecal contents were collected for SCFA quantification. Results are expressed as mean ± SEM (n = 5, mock and n = 9-11, IAV). (B) Right panel and (D) Significant differences were determined using the One-way ANOVA Kruskal-Wallis test (nonparametric), followed by the Dunn’s posttest test (* P < 0.05, ** P < 0.01, *** P < 0.001).

