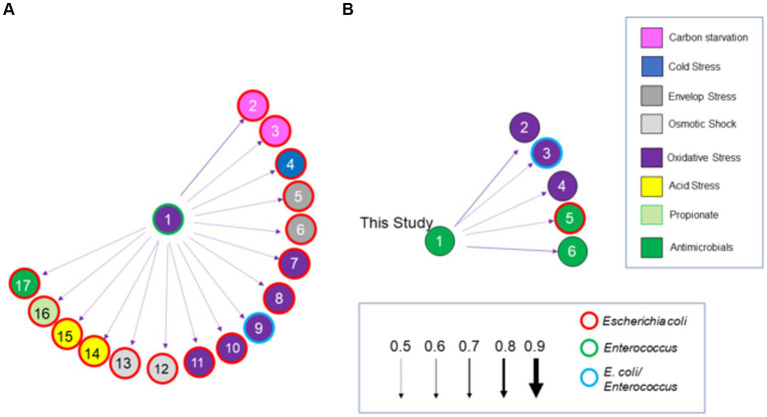
Figure 11.
A Bayesian network analysis of the cecal transcriptome, focused on stress response, from chickens with high (>5.85 Log10 Salmonella genomes/g) (A) or low (B) Salmonella abundance. The network depicted was constructed using the score-based learning algorithm Hill-Climbing (arrows with solid line). Arrows indicate the direction and strength of the connection. Enzymes are color-coded based on the stress response. Enzymes or genes identified in the high Salmonella abundance community (A) are: (1) organic hydroperoxide resistance protein (ohr); (2) universal stress protein E (uspE); (3) yciT; (4) cspI; (5) pspC; (6) rseA; (7) arcA; (8) glutaredoxin; (9) nrd; (10) yncG; (11) fmrR; (12) betI; (13) yehZ; (14) ybaT; (15) hdeA; (16) propanediol diffusion facilitator; (17) glutamate-1-semialdehyde aminotransferase. Enzymes or genes identified in the low Salmonella abundance community (B) are: (1) yersiniabactin non-ribosomal peptide synthase; (2) putative bacterial hemoglobin; (3) gshF; (4) hemW; (5) tehB; (6) thioesterase domains of type I polyketides. Circles with thick red, green, or blue borders are for enzymatic transcripts with 98–100% nucleotide identity, by BLAST scores, to Escherichia coli, Enterococcus spp. or both, respectively.

