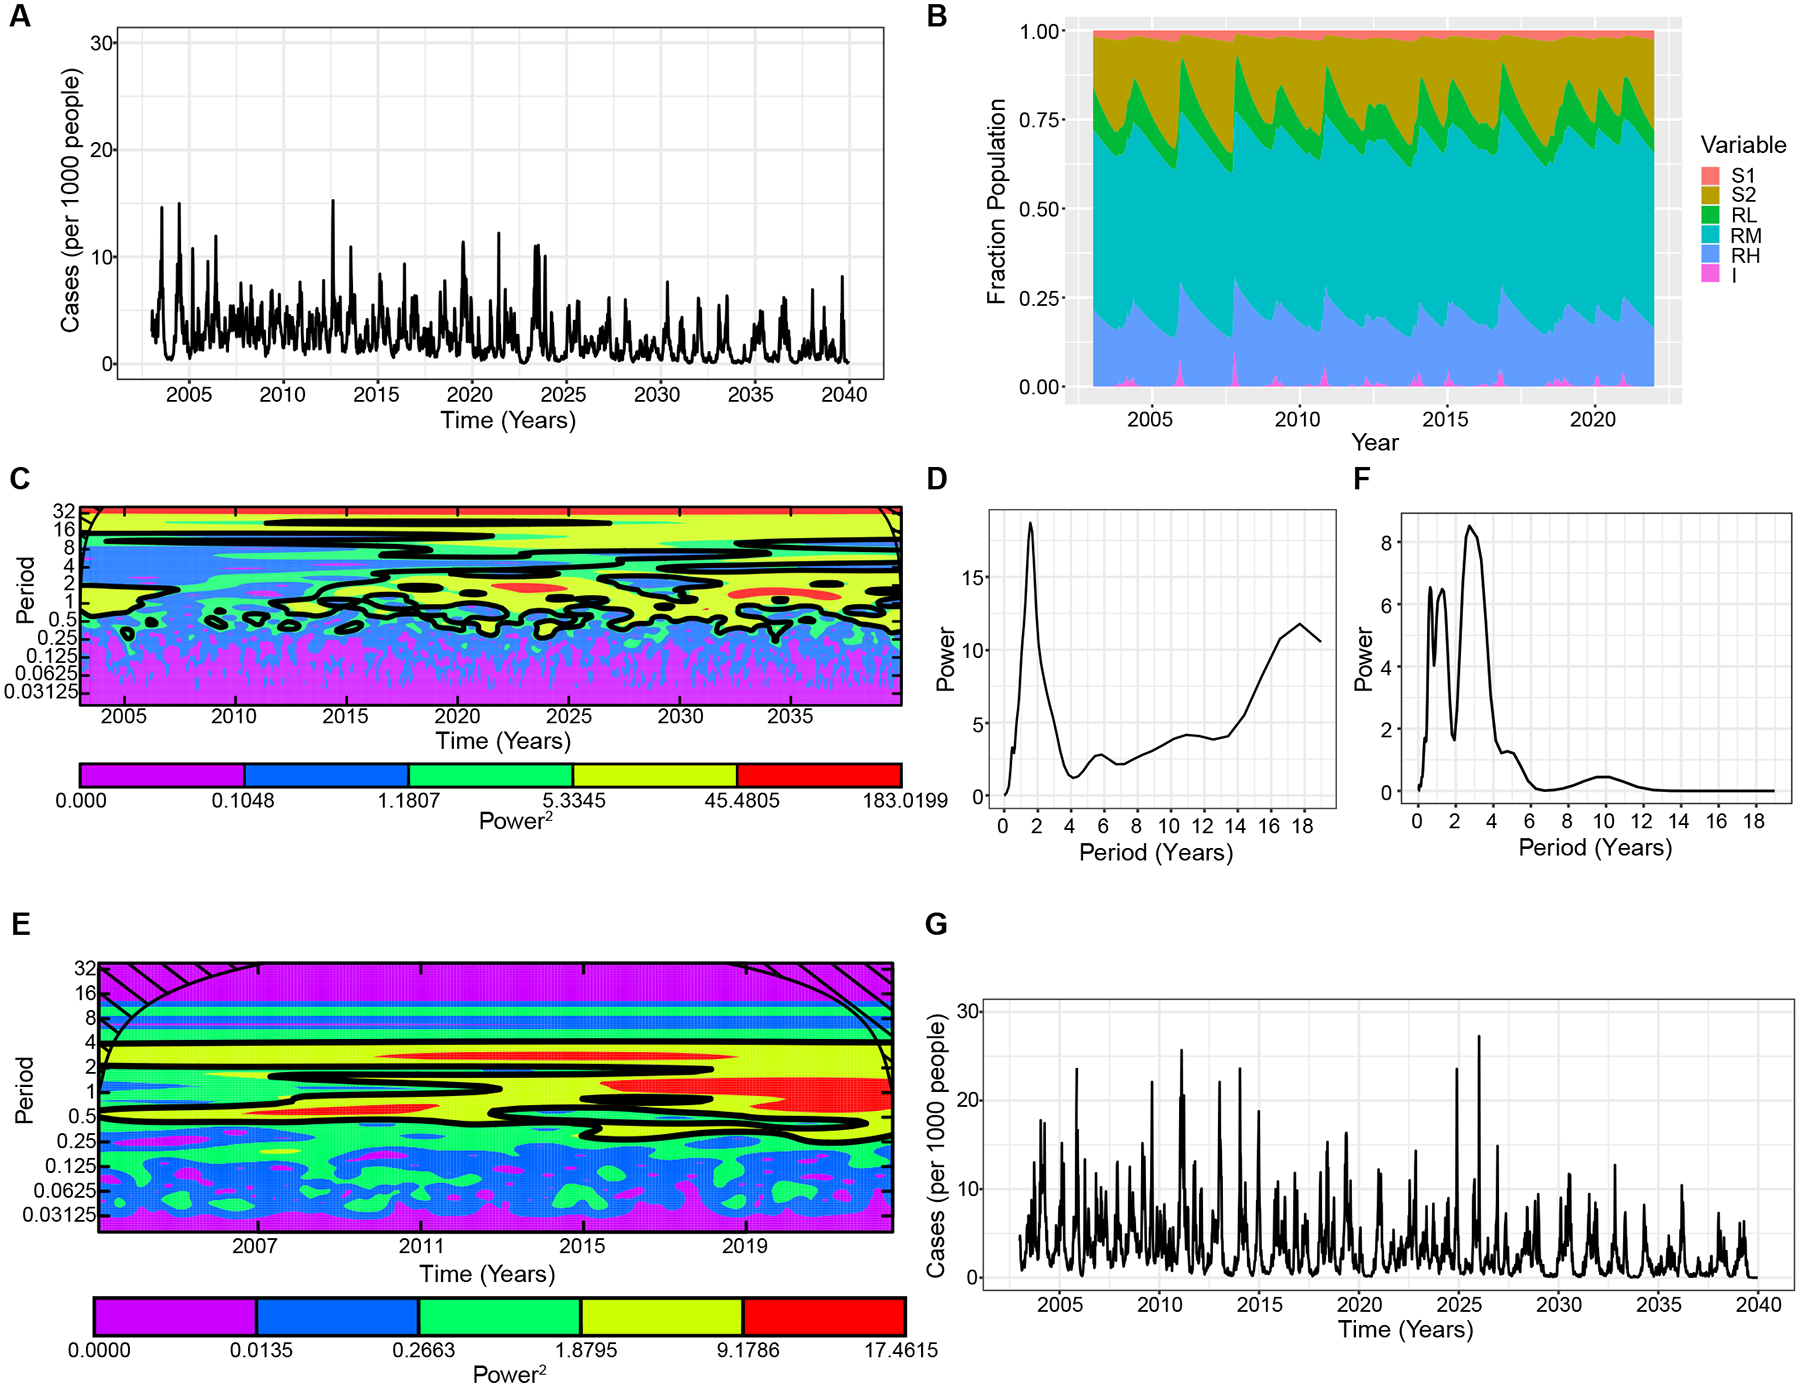
Fig. 4. Full model assuming immune boosting, waning, and ADE.

A. Simulated weekly dengue incidence in a population of 10 million, where the DENV reproduction number was set to 5 and individuals with previous DENV exposure experience 20% of the force of infection that a fully susceptible individual would. Simulation results are the mean of 10 realizations. B. Population distribution of each model compartment over time. C. Wavelet power spectrum (Morlet) of the time-series of log-transformed simulated weekly dengue incidence. The colors code for power values ranging from purple, low values, to red, high values. The black contours (outline) indicate the regions of greater than 95% confidence for the power values, indicating the most probable estimate of the interepidemic period. The cone of influence (black hashed lines) indicates where the power spectrum can be accurately estimated and is not influenced by effects of the edges of the time-series. D. Wavelet power spectrum for Fig. 4C averaged over the time course. E. Wavelet power spectrum of the observed Nicaraguan case data, and F. averaged over the time course. G. Simulated weekly dengue incidence for the full model as in Fig. 4A, but with seasonal forcing where and . is the baseline transmission rate, is the amplitude of seasonality. See Table S1 for other parameters used.
