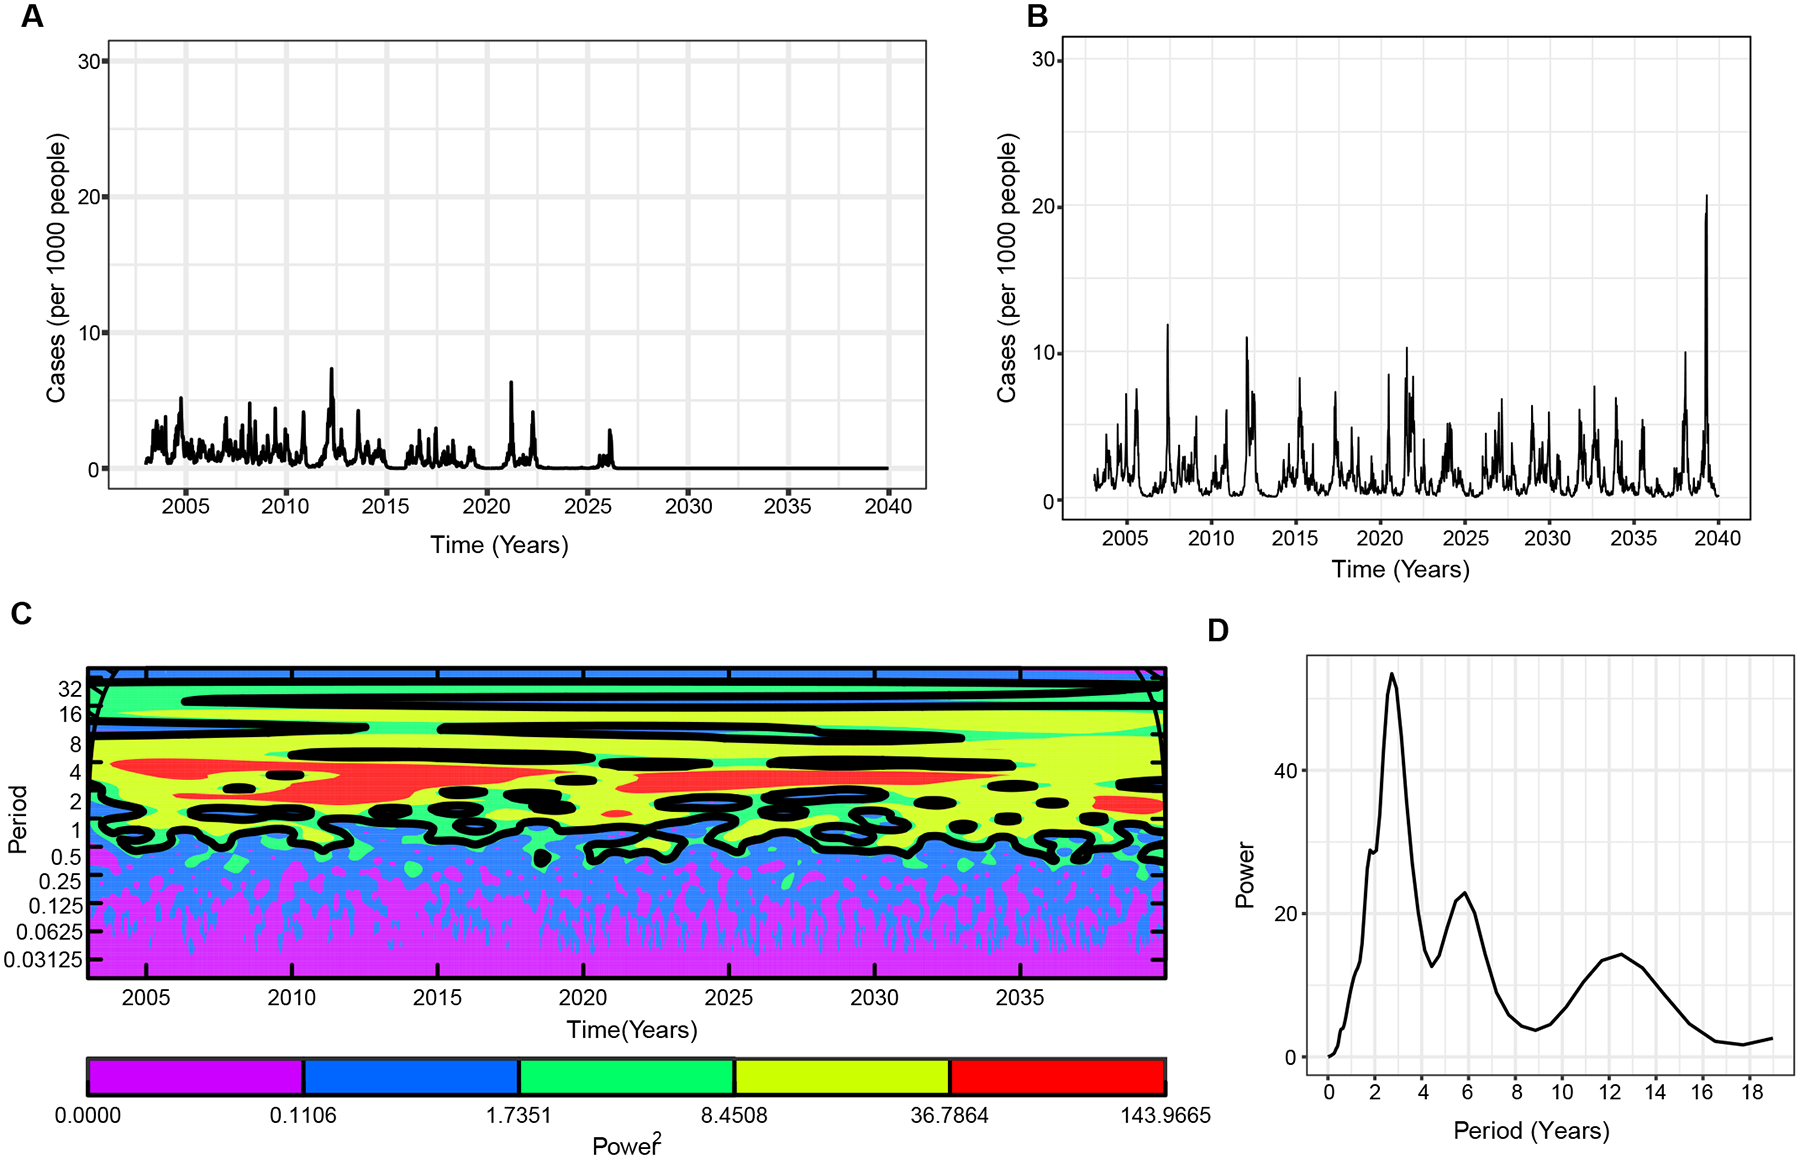
Fig. 5. Comparison of simulated weekly dengue incidence for two distinct models of life-long immunity.

A. Life-long immunity once individuals are boosted to the high immune group, assuming zero waning rate in the compartment. B. Same as A, but with constant influx of infections incorporated in the force of infection as ; where . Simulation results of the mean of 10 realizations. C. Wavelet power spectrum (Morlet) of the time-series of the log-transformed weekly dengue incidence in B, and D. averaged over the time course. The black contours in C (outline) indicate the regions of greater than 95% confidence for the power values. See Table S1 for other parameters used.
