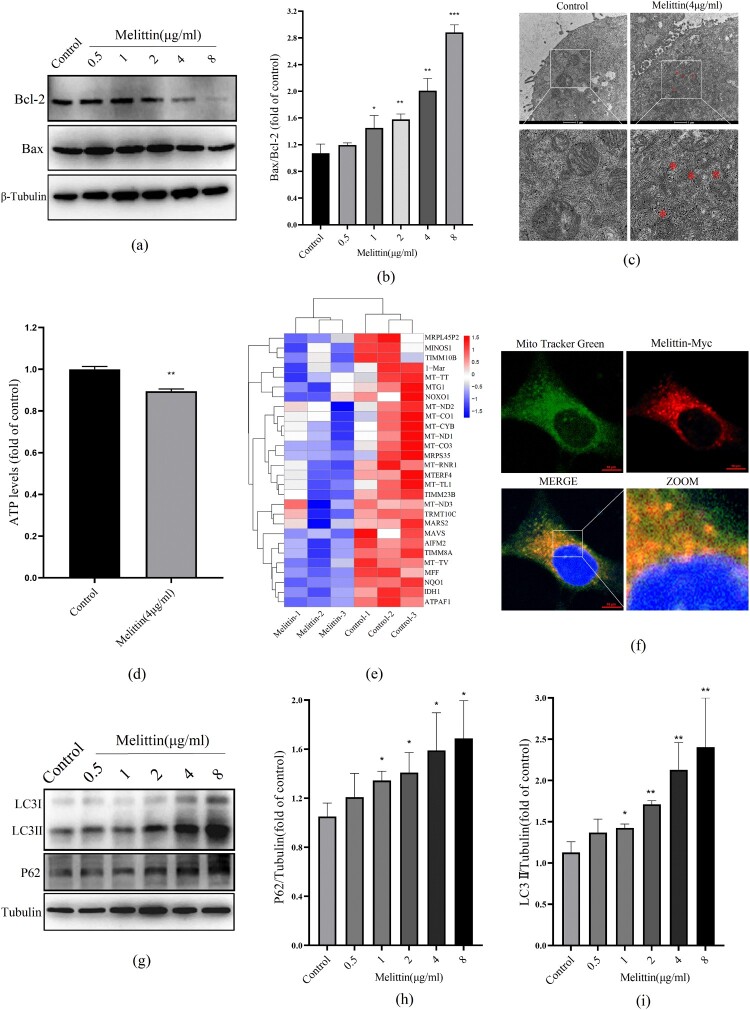
Figure 2.
Melittin targets binding to mitochondria and disrupts autophagy flux in A549 cells. (a) Western blot was used to test the level of Bcl-2 and Bax. (b) Statistics of Bax/Bcl-2. (c) Mitochondria morphology was observed with the electron microscope. (d) Statistics of ATP levels. (e) Heat map of mitochondrial function-related downregulated genes in RNA-seq analysis. (f) Cells were transfected with Melittin-Myc lentivirus for 24 h and then labeled with Mito Tracker Green, observed under the confocal microscope. (g) A549 cells were treated with or without melittin (0.5, 1, 2, 4, 8μg/ml) for 24 h. Western blotting was used to autophagy detect the marker protein LC3 and P62. (h) Statistics of P62 levels. (i) Statistics of LC3 alternation. *p < 0.05, **p < 0. 01, ***p < 0.001 versus the Control.

