. 2024 Apr 8;12:RP89482. doi: 10.7554/eLife.89482

Figure 1. Generation of a snRNAseq dataset from the mouse midbrain.

(A) Schematic design of the study, unilateral injection of low doses of 6-OHDA (0.7, 1.5 µg/µl) in the medial forebrain bundle (MFB), followed by dissection, nuclei isolation and enrichment via FANS, before library preparation, sequencing, and data analysis. (B) Transgenic, Cre-dependent mCherryTRAP mouse model. Slc6a3Cre and TrapCfl lines were intercrossed to generate Slc6a3Cre/+; TrapCfl/fl mice. (C) Immunohistochemical staining of the mouse ventral midbrain coronal section, showing the overlap of TH and mCherry. Scale bar = 100 μm. (D) UMAP projection of the all-nuclei dataset, with cluster color-coding. (E) Hierarchical dendrogram of the identified clusters and their descriptions with the same color-coding.

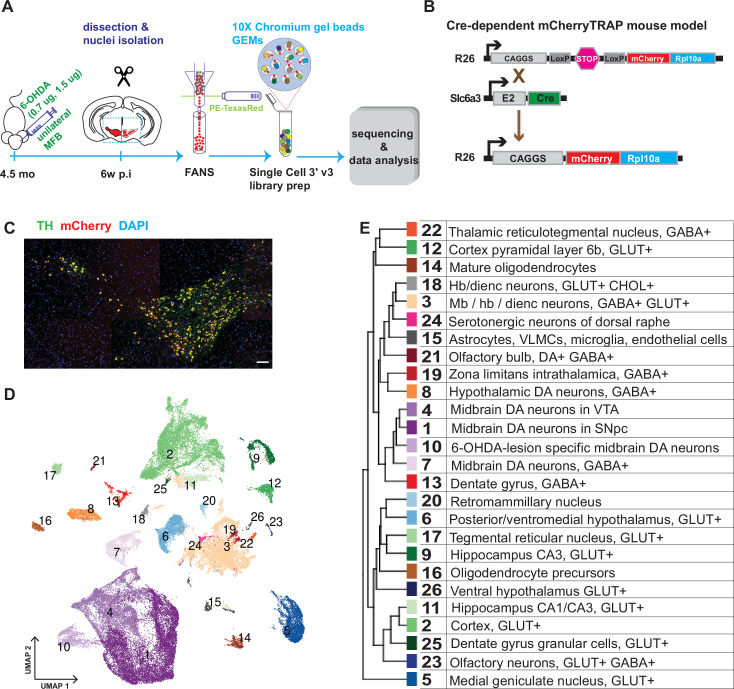
Figure 1.

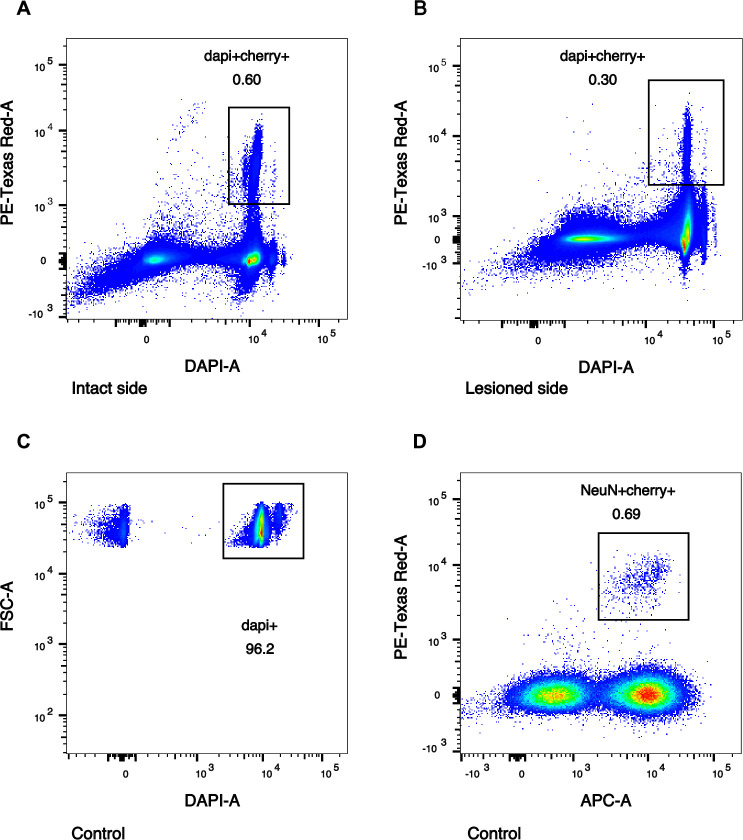
Figure 1—figure supplement 1. FANS plots for intact, lesioned, and untreated nuclei sorting.

Figure 1—figure supplement 1.

Representative FACS plots, enriching for midbrain dopaminergic nuclei. PE-Texas Red-A (y-axis) represents mCherry channel. (A, B) The DAPI+Cherry+ gates were set to select for all mCherry+ nuclei in intact (A) and lesioned (B) samples. (C, D) Control samples’ gates were first set to select for all DAPI+ nuclei (C), followed by gating for NeuN+Cherry+ nuclei (D). APC-A (x-axis) represents NeuN antibody channel.
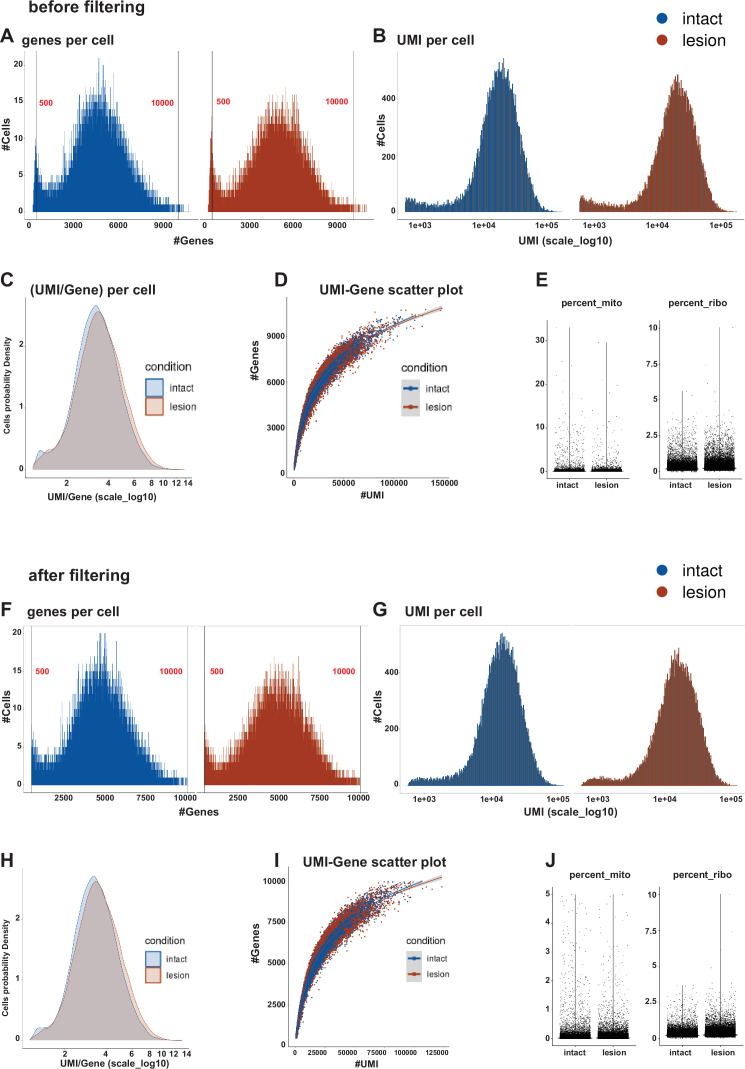
Figure 1—figure supplement 2. Quality control of snRNAseq data.

Figure 1—figure supplement 2.

Metrics and indexes of data quality control before QC filtering (A–E). Distribution of genes (A) and UMIs (B) in libraries per condition. Cells’ probability density plot for UMI/gene per condition (C). Correlation of UMIs to Genes, shown as a scatter plot for conditions (D). Percentages of mitochondrial and ribosomal transcripts (UMI) per condition (E). (F–J) The same metrics and indexes after QC filtering.
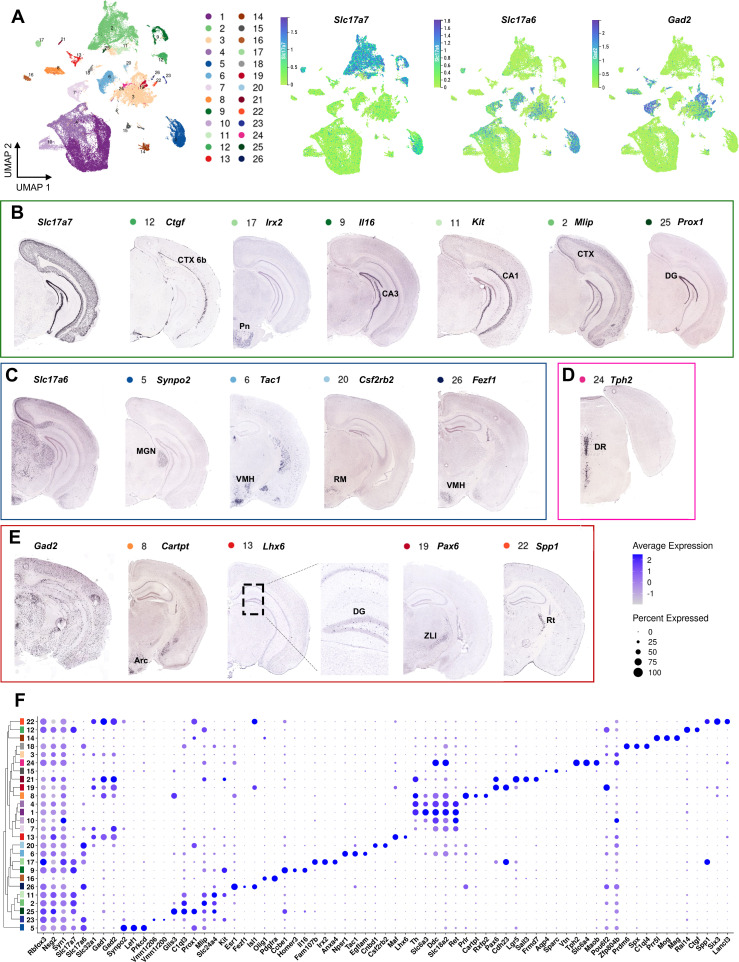
Figure 1—figure supplement 3. Spatial mapping of main non-mDA-clusters.

Figure 1—figure supplement 3.

(A) A UMAP projection of all the cells with color-coding key. UMAP projections of Slc17a7 (Vglut1, green clusters), Slc17a6 (Vglut2, blue clusters), and Gad2 (red and orange clusters) show the distribution of glutamatergic and GABAergic neuronal subtypes in various clusters. Cluster 3 contained a heterogenous mix of various midbrain and hypothalamic neurons expressing both glutamatergic, histaminergic and GABAergic markers. (B) Slc17a7-expressing neuronal populations with example enriched genes, with cluster numbers and color-coding indicated. The Slc17a7+neurons were mainly found in cortex (CTX) and hippocampus, as well as in the pontine nuclei (Pn). The largest Slc17a7+cluster (2) contained mixed cortical neurons. (C) Slc17a6+clusters were found in mostly in the midbrain and hypothalamus, for example in the medial geniculate nucleus (MGN), ventromedial hypothalamus (VMH), and retromammillary nucleus (RM). (D) Serotonergic neurons expressing Tph2 in dorsal raphe (DR). (E) GABAergic clusters expressing Gad2 were found dentate gyrus (DG), zona limitans intrathalamica (ZLI) and reticular nucleus (Rt). Cluster 8 co-expressed several DA genes, matching hypothalamic DA neurons. (F) A dotplot representation of the enriched genes in non-mDA clusters.