. 2024 Apr 8;12:RP89482. doi: 10.7554/eLife.89482

Figure 2. Midbrain DA dataset, cell types and composition.

(A) UMAP projection of the dopaminergic dataset, with numerical labels of the 71 clusters and color-coded for the major cell types. (B) Typical dopaminergic markers plotted in UMAP separately, with the top 1 percentile of the normalized gene expression range clipped for better visualization. (C) Hierarchical dendrogram of clusters from the dopaminergic nuclei dataset, with the cell-type enriched markers as a dotplot and cell-type color-coding. mODC = mature oligodendrocyte, HyDA = hypothalamic dopaminergic.

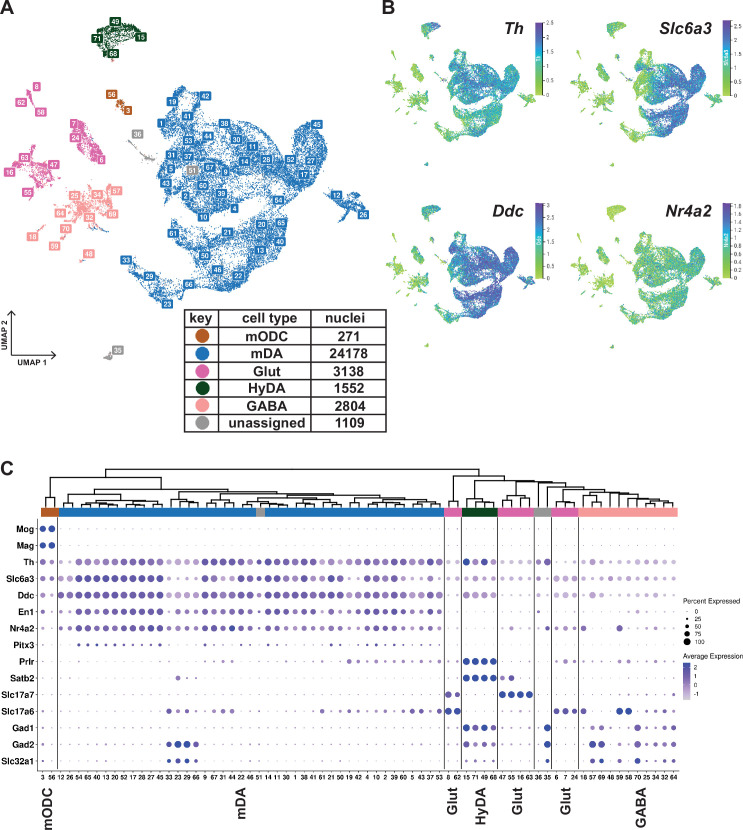
Figure 2.

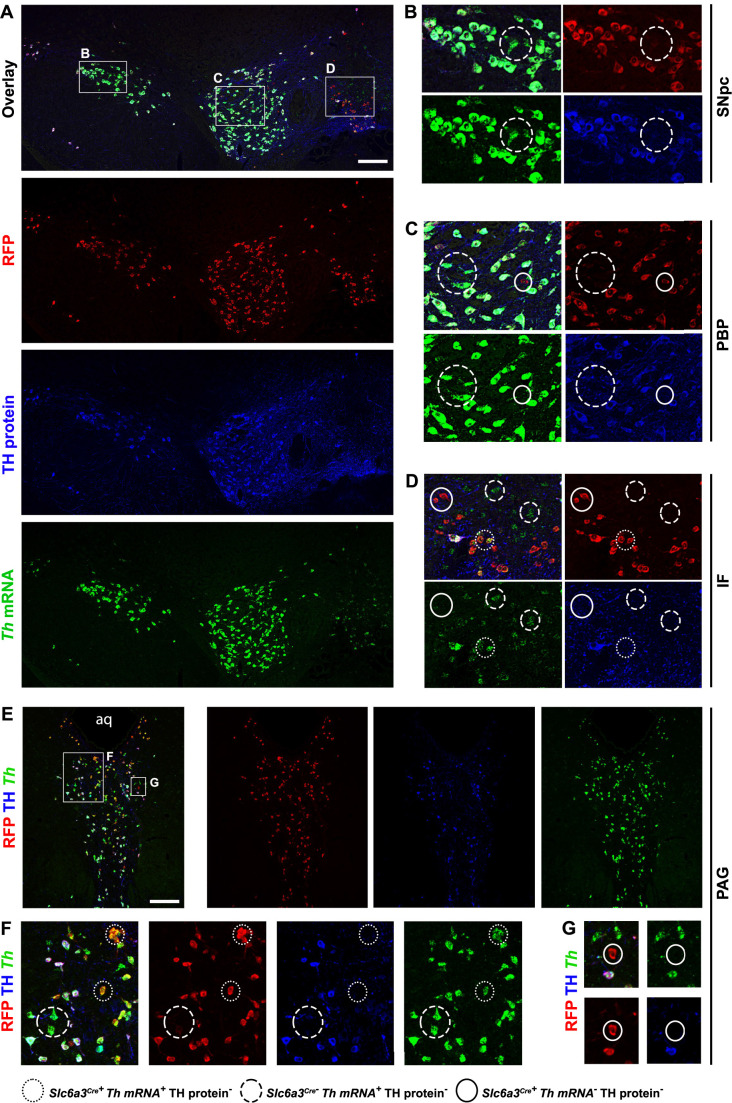
Figure 2—figure supplement 1. Distribution of Th mRNA and protein in different mDA populations.

Figure 2—figure supplement 1.

(A–G) In situ hybridization and immunohistochemistry for Th mRNA and protein across the midbrain in 2 months old Slc6a3Cre/+; R26TrapC/+ mice. In most of the RFP+ cells both Th mRNA and protein can be detected. We detected some cells which were labelled with Dat-Cre and expressed mRNA but lacked TH protein (dotted circles), and some which expressed only Th mRNA but lacked both RFP and TH protein (dashed circles). These cells were not concentrated in any particular mDA neuron nuclei but were found scattered across VTA and SNpc. We also detected very rare cells in the medial regions of VTA and PAG which were labelled with Dat-Cre but lacked both Th mRNA and protein (solid circles). Aq, aqueduct; SNpc, Substantia Nigra pars compacta; PBP, Parabrachial Pigmented Nucleus; IF, Interfascicular Nucleus; PAG; Periaqueductal Grey. Scale bars = 100 μm.