. 2024 Apr 8;12:RP89482. doi: 10.7554/eLife.89482

Figure 5. Normalized cell loss across territories and neighborhoods in mDA dataset.

(A, B) UMAP projection of the dopaminergic dataset nuclei from the intact (un-lesioned) and the lesioned hemisphere, respectively. (C) Calculated normalized cell loss for territories, visualized as percentages. (D) Pairwise comparison of normalized cell loss across territories. (E) Calculated normalized cell loss for neighborhoods, visualized as percentages. Comparisons were made between neighborhoods within each territory. See methods for the statistical tests used. (F) Percentages of nuclei in each major cell type from either intact or lesioned samples. Sample size per condition (n) = 6, ns = not significant, * p≤0.05, **p≤0.01, *** p≤0.001, **** p≤0.0001. For the Conover-Iman test; p-value = P(T ≥ |t|), and null hypothesis (H0) was rejected at p ≤ α/2, which is 0.025. Error bars show standard deviation (SD).

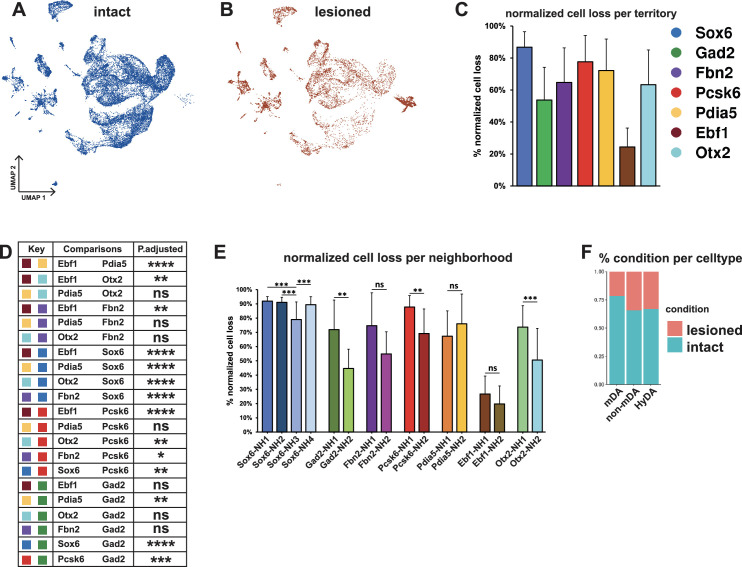
Figure 5.

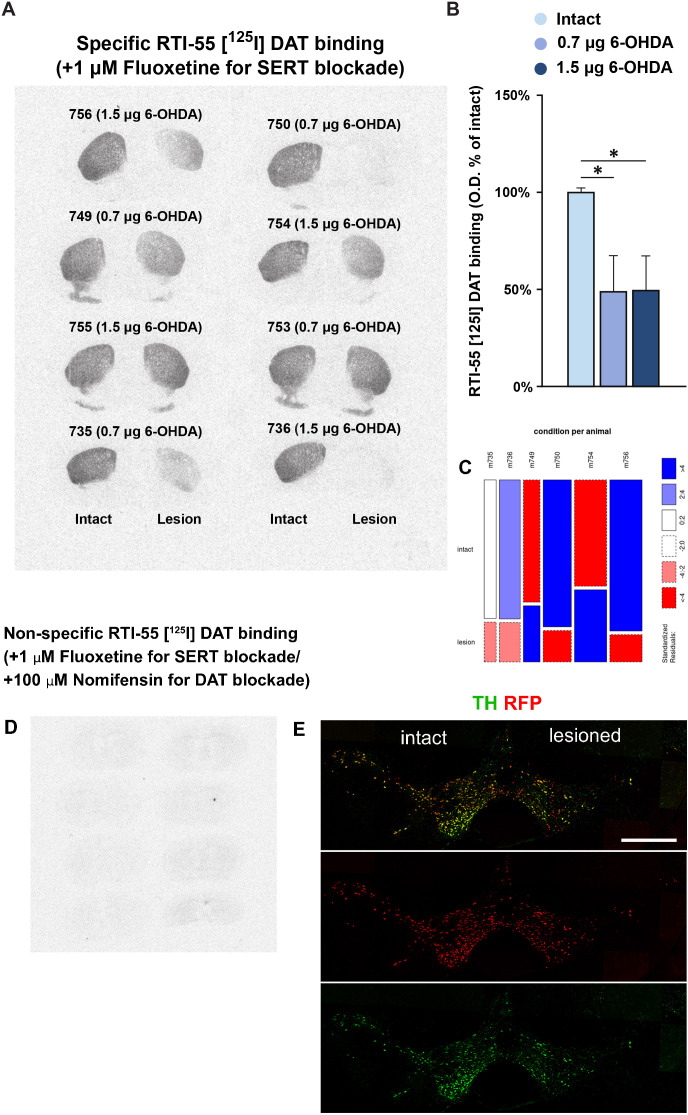
Figure 5—figure supplement 1. Validation of unilateral 6-OHDA-induced lesion.

Figure 5—figure supplement 1.

(A) DAT-binding autoradiography of striatal tissue. See Materials and methods for details. (B) Quantification of the autoradiographs in A, with both doses of 6-OHDA being significantly different from the intact (un-lesioned) side. One way ANOVA, with * showing p<0.05. Samples sizes are n=8 for intact and n=4 for either lesioned dose. Error bars show the standard error of the mean (SEM). (C) Mosaic plot showing the residuals of Pearson’s Chi square test of independence, with the two conditions as the categorical variables. The plot shows deviations of the observed values from the expected values under the null hypothesis if the categorical variables were independent. However, the test shows that the categorical variables are significantly associated (p-value <2.2e-16). The negative residuals denote that the observed values are smaller than expected, while the positive residuals denote that the observed values are larger than the expected. The width and height of the mosaics signify the number of nuclei per animal and per condition, respectively. (D) Control for non-specific DAT binding with dopamine reuptake inhibitor, nomifensine. (E) An example of a 6-OHDA lesioned midbrain, coronal section stained with antibodies against TH and RFP. Scale bar = 1 mm.