. 2024 Apr 8;12:RP89482. doi: 10.7554/eLife.89482

Figure 7. Transcriptional kinship and enriched markers of ML clusters.

(A) UMAP projection of the dopaminergic dataset nuclei from the intact (non-lesioned) hemisphere. (B) UMAP projection of the dopaminergic dataset nuclei from the lesioned hemisphere. ML clusters are marked with dashed circles in A and B. (C) UMAP projection of the integrated dopaminergic nuclei dataset, color-coded for the territory IDs of the merged dataset. (D, E) Sox6 and Calb1 expression plotted in intact and lesioned nuclei, respectively. (F) Same UMAP projection as in C, with ML clusters nuclei highlighted. (G, H) Bar graphs showing the numbers and percentages of ML clusters nuclei per territory of the integrated dataset, respectively. More than 80% of ML nuclei cluster in Sox6 and Pcsk6 territories of the integrated data. (I) Mostly lesioned (ML) clusters enriched markers plotted in UMAP. (J–M) ML-enriched markers in I, detected by fluorescent RNA in situ hybridization, combined with TH and mCherry immunohistochemistry in lesioned versus untreated tissue. Scale bar = 50 µm.

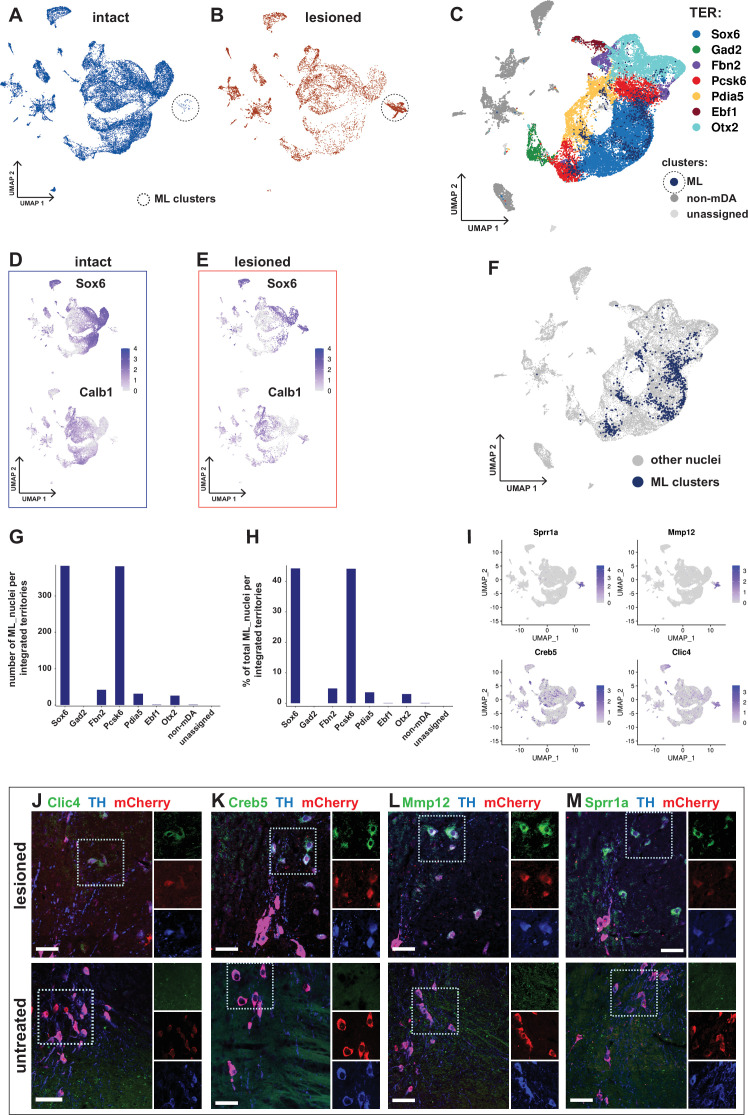
Figure 7.

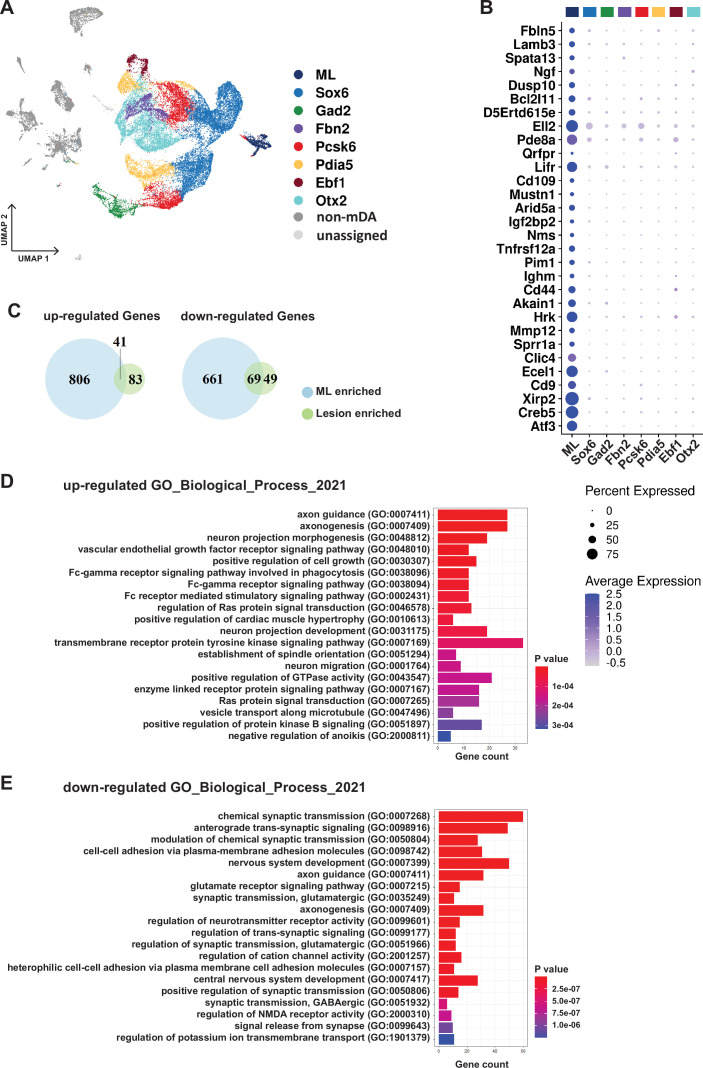
Figure 7—figure supplement 1. ML-clusters enriched genes and GO analysis of ML-specific enriched genes.

Figure 7—figure supplement 1.

(A) UMAP projection of the dopaminergic dataset with territory color-coding. (B) Dotplot with enriched markers for ML clusters, ranked by adjusted p values. (C) Venn diagrams with differentially expressed genes in all lesioned nuclei when compared to all intact nuclei, and in ML clusters when compared to all other territories, as well as the common genes between the two sets. (D, E) Top 20 enriched GO terms, ranked by p value, using genes upregulated and downregulated only in the ML clusters when compared to all other territories (blue sector in C), with GO_Biological_Process_2021 as the gene-set library.
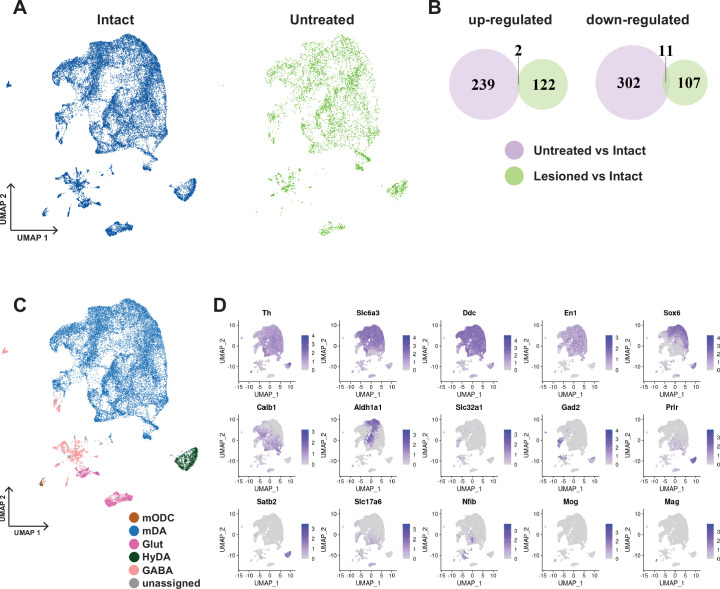
Figure 7—figure supplement 2. UMAP, Comparative DE analysis and canonical cell type markers in intact-untreated dataset.

Figure 7—figure supplement 2.

(A) UMAP projections of the merged intact +untreated nuclei dataset, split by the group, intact vs untreated. (B) Venn diagrams showing differentially expressed genes between untreated vs intact nuclei and between lesioned vs intact nuclei as well as the overlap of the two sets of genes. (C) UMAP projection of this dataset (intact +untreated), color-coded for the major cell types. (D) Markers plotted in UMAP for different cell types in C.