. 2024 Apr 8;12:RP89482. doi: 10.7554/eLife.89482

Figure 8. Integration of human and mouse datasets.

(A, B) UMAP projections of the integrated dopaminergic human (control +diseased) and mouse (intact +lesioned) nuclei, split per condition. This integrated dataset includes 25,003 human nuclei and 33,052 mouse nuclei. (C) UMAP projections of the human and mouse nuclei grouped by condition. Dataset was generated using the Seurat canonical correlation analysis (CCA). Ctrl = control neurotypical, PD = Parkinson’s disease, LBD = Lewy body dementia, intact = non-lesioned.

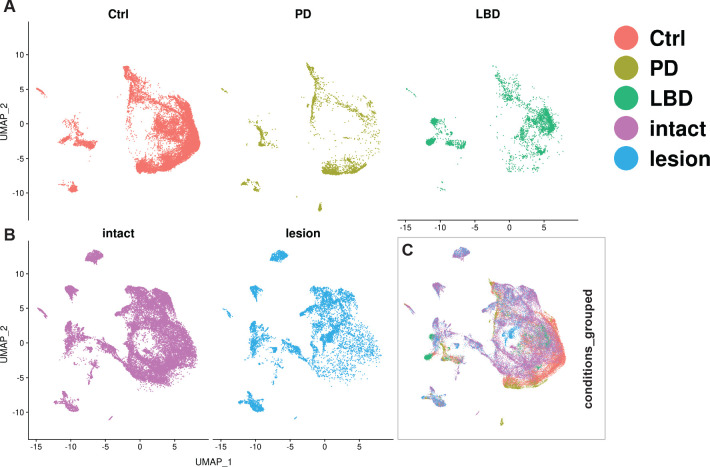
Figure 8.

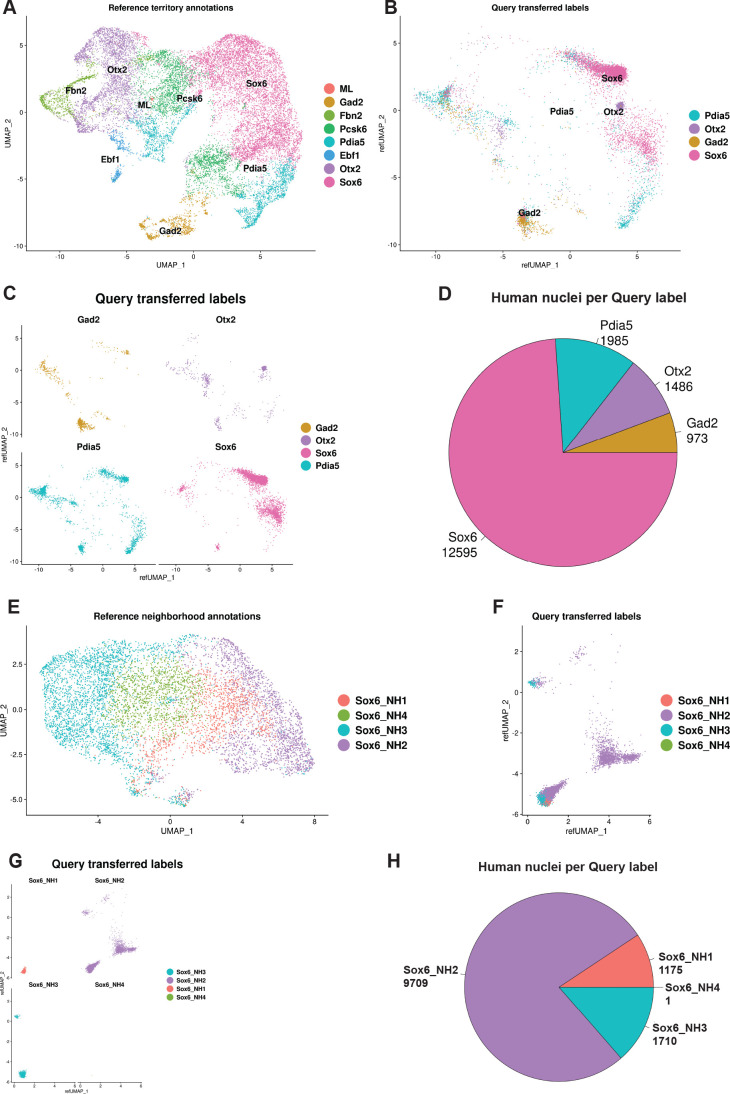
Figure 8—figure supplement 1. Integrated mouse-human mDA dataset.

Figure 8—figure supplement 1.

(A, B) Mapped and annotated human dopaminergic control nuclei (B) by using mouse intact nuclei from mDA territories (A) used as reference UMAP. (C) Human nuclei in B, split by the transferred labels. (D) Numbers of mapped and annotated human nuclei in C, per transferred labels. (E, F) Mapped and annotated human dopaminergic control nuclei which were already labeled as Sox6 in C, by using mouse intact nuclei from only Sox6 territory used as reference UMAP. (G) Human nuclei in F, split by the transferred labels. (H) Numbers of mapped and annotated human nuclei in G, per transferred labels.