Abstract
Purpose
Investigate the mechanism of how sodium butyrate (NaBut) improves mitochondrial function and kidney tissue injury in diabetic kidney disease (DKD) via the AMPK/PGC-1α pathway.
Methods
Assess the effects of NaBut on glucose and insulin tolerance, urine, and gut microbial composition in db/db and db/m mice. Use flow cytometry and western blotting to detect the effects of NaBut on apoptosis, kidney mitochondrial function, and AMPK/PGC-1α signaling. Use HK-2 cells induced by high glucose (HG) to establish the DKD model in vitro and detect changes in the AMPK/PGC-1α signaling pathway and mitochondrial function after NaBut intervention.
Results
NaBut attenuated blood glucose levels and reversed increases in urine and serum levels of glucose, BUN, Ucr, TG, TC, and UAE in db/db mice. NaBut improved insulin tolerance, reversed PGC-1α and p-AMPK expression level in the kidneys of db/db mice, and improved lipid accumulation and mitochondrial function. NaBut was able to reverse the effects of elevated glucose, compound C, and siRNA-PGC on ROS and ATP levels. Additionally, it increased protein expression of PGC-1α and p-AMPK.
Conclusion
NaBut activates the kidney mitochondrial AMPK/PGC-1α signaling pathway and improves mitochondrial dysfunction in DKD, thus protecting kidney tissue in vitro and in vivo.
Keywords: Sodium butyrate, diabetic kidney disease, mitochondrial function, AMPK/PGC-1α pathway
Introduction
Diabetes mellitus (DM) is a metabolic disease and one of the three major noncommunicable chronic diseases in the world. Research data shows that DM is the leading cause of end-stage dialysis treatment for kidney failure in many countries [1]. Diabetic kidney disease (DKD) is a chronic kidney disease caused by DM. It is one of the most common complications of DM and the main cause of end-stage kidney disease [2]. Most current treatment strategies are aimed at hyperglycemia, hyperlipidemia, oxidative stress, inflammatory factors, and genetic factors such as glucocorticoids, calcineurin antagonists, and mTOR inhibitors [3]. Despite significant improvements in the treatment of diabetes, many patients still suffer from progressive DKD. Prolonged exposure to high glucose levels is a major cause of kidney disease; however, the mechanisms that lead to kidney damage are unclear. Therefore, there is an urgent need to further study the pathogenesis of DKD to improve the treatment methods.
Mitochondria are highly complex interconnected organelle networks that meet cellular energy requirements and maintain normal structure and kinetic homeostasis under the action of kinetic-related proteins [4]. The kidney is rich in mitochondria, which require large amounts of oxygen and energy to maintain its normal function [5]. Recent studies have shown that the occurrence of DKD is largely associated with mitochondrial damage and dysfunction [4,6,7]. Mitochondrial dysfunction leads to decreased adenosine triphosphate synthesis and increased production of mitochondrial reactive oxygen species, promoting kidney injury and inflammation [8]. Kidney mitochondrial dysfunction may precede the development of DKD. Increased expression of renin receptors in kidney mitochondria and diabetic kidneys can lead to diabetic kidney mitochondrial dysfunction [9]. Adenosine monophosphate-activated protein kinase (AMPK)/peroxisome proliferator-activated receptor gamma coactivator 1α (PGC-1α) is an important signaling pathway involved in the regulation of mitochondrial energy homeostasis in DKD, and inhibition of the AMPK/PGC-1α pathway leads to mitochondrial dysfunction. Cells directly regulate mitochondrial biogenesis and function through the AMPK/PGC-1α signaling pathway, which plays a key role in pathophysiological mechanisms [10,11]. Glycyrrhizic acid attenuates kidney histopathological damage in diabetic db/db mice by inhibiting kidney ROS and activating the AMPK/silent information regulator 1 (SIRT1)/PGC-1α signaling pathway [12]. Therefore, AMPK/PGC-1α, a major regulator of mitochondrial biogenesis, is a potential therapeutic target for DKD.
In recent years, the role of gut microbe-derived short-chain fatty acids (SCFAs) in kidney disease has become an exciting field [13]. Clinical data have shown gut dysbiosis in DKD patients [14]. The concentration of total SCFAs in serum and feces (especially feces) was reduced, with a significant decrease in the average concentrations of acetate, propionate, and butyrate [15]. The decrease in SCFA levels was correlated with the deterioration of kidney function [16]. Exogenous SCFAs, especially butyrate, were identified by evaluating the role of three major SCFAs (acetate, propionate, and butyrate) in streptozotocin (STZ)-induced DKD mice, ameliorating kidney injury by inhibiting oxidative stress and NF-κB [17]. Sodium butyrate (NaBut), an SCFA, has been shown to significantly ameliorate kidney oxidative damage, inflammation, apoptosis, fibrosis, pathological changes, and proteinuria in streptozotocin-induced diabetic C57BL/6 mice [18]. However, the mechanism by which NaBut protects the kidney tissue during the progression of DKD remains unclear. Based on findings in db/db diabetic mice and HK-2 cells induced by high glucose, this study assessed the relationship between gut microbial composition and kidney tissue injury and explored the regulation of the NaBut-targeting AMPK/PGC-1α signaling pathway on mitochondrial function, thus providing a new strategy for DKD targeted therapy.
Materials and methods
Animal and model construction
Sixteen male db/db mice (C57BLKS (BKS), (−/−)) and sixteen db/m mice (C57BLKS (BKS), (±)) (8 weeks old) were purchased from GemPharmatech Co., Ltd. (Nanjing, China). All mice were kept under specific pathogen-free (SPF) conditions at 22 ± 2 °C, 50–60% relative humidity under a 12/12-h light/dark cycle. All the mice had access to food and water. All the mice were randomly assigned at the beginning of the experiment, with eight mice per group: db/db mice were divided into DKD and DKD + NaBut groups, and db/m mice were divided into NC and NC + NaBut groups (Table 1). The mice in the DKD and NC groups were fed a standard diet for 20 weeks. From the 8th week, mice in DKD + NaBut and NC + NaBut groups were gavaged with 1000 mg/kg/d sodium butyrate (Sigma, St. Louis, MO, USA). Our previous experiment found that 1000 mg/kg/d sodium butyrate did not induce death or organ lesions in mice after seven days of intragastric administration. In the 20th week, the level of glucose in the urine was measured according to the manufacturer’s instructions (Nanjing Jiancheng Bioengineering Institute, Nanjing, China). Blood from the tail vein was collected on a testing paper to measure blood glucose levels.
Table 1.
Animals grouping.
| Group | Sample size | Treatment |
|---|---|---|
| NC | n = 8 | – |
| NC + NaBut | n = 8 | NaBut |
| DKD | n = 8 | / |
| DKD + NaBut | n = 8 | NaBut |
NC: negative control group (db/m mice), DKD: diabetic kidney disease group (db/db mice).
The glucose tolerance test (OGTT) and insulin tolerance test (ITT) were performed at the end of the experiment. OGTT is an oral GTT, ITT was performed by intraperitoneal injection of insulin. Fasting blood glucose values were measured after a 6 h fasting period as the 0-min blood glucose level. Mice were gavaged with glucose (2 g/kg), and blood glucose levels were measured 30, 60, 90, and 120 min after gavage. For the ITT, mice were injected with 1 U/kg insulin, and blood glucose concentrations were measured 0, 30, 60, 90, and 120 min after injection. Experimental design in supplementary figure 1.
Ethics committee
All animal experiments are in line with the relevant provisions of the Ethical Certificate of Experimental Animals of the Hubei Provincial Animal Administration Commission. License No.: SYXK (E) 2018-0104. Animal certificate number: NO.320727211100345037, NO.320730211100038314. All protocols involving animals were performed according to the ARRIVE Guidelines 2.0.
Specimen collection
In the 20th week, pentobarbital sodium was anesthetized to death, urine, serum, and feces were collected from the mice. Urea nitrogen (UN), creatinine (Cr), total triglyceride (TG), total cholesterol (TC), and urinary albumin (UAE) levels were measured according to the manufacturer’s instructions (Nanjing Jiancheng Bioengineering Institute, Nanjing, China). Sodium butyrate content was quantified by GC-MS, while changes in gut microbes were analyzed by 16S rDNA high-throughput sequencing. After blood collection, mice were sacrificed using 100 mg/kg sodium pentobarbital (Sigma, Merck, USA). Kidney tissues were extracted for further analysis. ATP content in the kidney tissue was detected using ELISA kits (Bioswamp, Wuhan, China) according to the manufacturer’s instructions. The levels of NADP+ and NADPH were measured using the NADP+/NADPH assay kit (Nanjing Jiancheng Bioengineering Institute, Nanjing, China) according to the manufacturer’s instructions.
Fecal sample collection and 16S rDNA high-throughput sequencing
The animals were placed in an independent ventilated cage, and the disinfected nursing pad was placed in the cage before sampling, and the fresh feces of the small animals were collected within 30 min. After the mice were sacrificed, the intestinal contents were collected in 0 °C environment. Collect fresh feces or intestinal contents, add 10 μL sodium azide at a mass-to-volume ratio of 1/100 (w/v), Liquid nitrogen freeze 15 min, Save to −80 °C, Low temperature transportation of sufficient dry ice. Extract total DNA from fresh feces or intestinal contents. Primers designed according to conserved regions, add a sequencing adaptor at the end of the primer, PCR amplification and purification, quantification, and homogenization of its products to form a sequencing library, Agilent High Sensitivity DNA Kit was used to check the quality of the library, Double-ended sequencing with MiSeq sequencer. Data screening, analysis of flora composition and abundance, phylum level analysis.
Cell culture and treatment
Human kidney-2 (HK-2), a proximal tubular cell (PTC) line derived from normal kidney. HK-2 cells were cultured in DMEM/F12 supplemented (Hyclone, UT, USA) with 10% FBS (Gibco, Gaithersburg, MD, USA), 1% penicillin-streptomycin medium at 37 °C in a 5% CO2 atmosphere. To assess the toxicity of NaBut on HK-2 cells, the cells were treated with NaBut (0.25, 0.5, 1, 2, 5, and 10 mM) for 24, 48, and 72 h. To induce the DKD cell model, HK-2 cells were treated with 30 mM glucose for 24, 48, and 72 h to determine the optimal treatment time [19]. High glucose-induced cells were subsequently treated with NaBut (0.25, 0.5, 1, 2, 5, and 10 mM) for 0, 24, 48, and 72 h to assess the effect of NaBut. siRNA corresponding to the PGC-1α sequence was designed, synthesized, and transfected into cells treated with high glucose. NaBut (1 mM) as an intervention reagent, an AMPK inhibitor (dorsomorphin, Compound C, CC, 5 μM [20], MCE, NJ, USA), or siRNA-PGC was used to inhibit the AMPK/PGC-1α pathway in HK-2 cells. The ultrastructure of the mitochondria was observed using a transmission electron microscope.
CCK-8 assay
HK-2 cells were seeded into 96-well plates at a density of 3 × 10³ cells/well. The cells were then treated with NaBut (0.25, 0.5, 1, 2, 5, and 10 mM) or 30 mM glucose for 24, 48, or 72 h. In addition, high glucose-induced cells were subsequently treated with NaBut (0.25, 0.5, 1, 2, 5, and 10 mM) for 0, 24, 48, and 72 h. After treatment, 10 μL CCK8 (Solarbio, Beijing, China) was added and incubated for 4 h. The absorbance was measured at 450 nm.
Plasmids and transfection
5 × 10⁵ cells were inoculated in 6-well plates 24 h before transfection. 100 pmol miRNA was diluted in 250 µL OPTI-MEM, and gently soiled for 5 times. Dilute 5 µL Lipofectamine® RNAiMAX in 250 µL OPti-MEM, then gently smooth it for 5 times, and let it stand for 5 min at room temperature. The two solutions were gently homogenized for 5 times and incubated at room temperature for 20 min to obtain the complex. 500 µL compound was added to the cells and the plates were shaken. After 4 h culture, the new medium was replaced and cultured for 24 h to detect the expression of transferred genes.
Histopathological examination
The kidney tissues underwent dehydration, paraffin embedding, and were cut into 3 μm thick sections using a microtome. Morphological changes in the kidney tissues were observed through periodic acid-Schiff (PAS) staining (Solarbio, Beijing, China) and hematoxylin and eosin (H&E) staining (Solarbio, Beijing, China). The mitochondrial ultrastructure of the kidney tissue was examined using transmission electron microscopy (TEM).
Following sectioning, the kidney tissues were sliced into 5 μm sections and stained with Oil Red O (Servicebio, Wuhan, China) to assess the oil content in the kidney tissue. For immunohistochemical (IHC) studies, paraffin-embedded kidney sections were dewaxed, rehydrated, blocked, and incubated overnight with PGC-1α antibody (Invitrogen, CA, USA). The sections were then incubated with the MaxVision TM HRP-Polymer anti-Mouse/Rabbit IHC Kit (Maixin, Fuzhou, China), stained with diaminobenzidine (Solarbio, Beijing, China), sealed, and observed under a microscope. Kidney sections intended for TUNEL staining were sequentially immersed in xylene and alcohol, followed by incubation in Proteinase K solution (Solarbio, Beijing, China). TUNEL reaction mixture (ROCHE, Basel, Switzerland) was added to the sections, incubated in a dark chamber, and subsequently examined for apoptosis in the kidney sections.
Flow cytometry
To evaluate ROS levels, kidney tissues were rinsed with PBS, resuspended in erythrocyte lysate, neutralized with an equal volume of PBS, centrifuged, and resuspended in PBS. ROS levels were detected using flow cytometry according to the manufacturer’s instructions (Beyotime, Shanghai, China).
To evaluate apoptosis, 1 × 10⁶ cells were centrifuged and resuspended in 200 μL of PBS. 10 μL Annexin V-FITC and 10 μL PI (BD, New Jersey, USA) were gently mixed and incubated at 4 °C for 30 min in the dark. After the addition of 300 μL of PBS, the cells were subjected to flow cytometry.
To evaluate the mitochondrial membrane potential, 1 × 10⁶ cells were resuspended in cell culture medium (0.5 mL) and incubated with JC-1 staining solution (0.5 mL) for 20 min. The cells were then centrifuged and resuspended in JC-1 staining buffer (Beyotime, Shanghai, China). Mitochondrial membrane potential was detected by flow cytometry.
Real-time PCR
Total RNA was extracted from the cells using the TRIzol reagent (Ambion, TX, USA). cDNA was obtained by reverse transcription kit, according to the manufacturer’s instructions (Takara, Beijing, China). The mRNA expression level of PGC-1α was detected using RT-PCR. The primer sequences were as follows: PGC-1α, forward 5′-CAATTGAAGAGCGCCGTGT-3′, reverse 5′-CCATCATCCCGCAGATTTAC-3′; GAPDH, forward 5′-GGGAAACTGTGGCGTGAT-3′, reverse 5′-GAGTGGGTGTCGCTGTTGA-3′. Using GAPDH as an internal reference gene, relative expression was calculated using the 2−△△Ct method.
Western blot
Total protein was extracted from the kidney tissue and cells, for tissue samples, the kidney tissues were homogenized in ice-cold lysis buffer containing a protease inhibitor cocktail (Roche, Basel, Switzerland) to prevent protein degradation. The homogenates were then centrifuged at a specific speed and duration to separate the soluble protein fraction from cellular debris, for cell samples, the cells were first harvested and washed with phosphate-buffered saline (PBS). Subsequently, they were lysed in a lysis buffer supplemented with a protease inhibitor cocktail. The lysates were then subjected to centrifugation to obtain the protein-containing supernatant, and the protein concentration was determined using the BCA protein concentration assay kit (Solarbio, Beijing, China). Proteins (20 μg) were separated by gel electrophoresis and transferred onto a PVDF membrane. The membranes were blocked at 4 °C overnight and incubated at room temperature for 1 h with the following antibodies: Sterol-regulatory element binding proteins (SREBP-1c), Fatty acid synthase (FAS), Peroxisome Proliferator Activated Receptor Gamma (PPAR-γ), Carnitine Palmitoyltransferase 1(CPT-1), Peroxisome Proliferator Activated Receptor Alpha (PPARα), Acyl-CoA Oxidase 1 (ACOX1), cleaved caspase 3, BCL2 Associated X, Apoptosis Regulator (Bax), BCL2 Apoptosis Regulator (Bcl-2), mitochondrial transcriptional factor A (mtTFA), nuclear respiratory factor 1 (NRF1), Mitofusin2 (MFN2), dynamin-related protein 1 (DRP1), AMPK, GAPDH antibodies (Bioswamp, Wuhan, China); p-DRP1, PGC-1α (Invitrogen, CA, USA); p-AMPK (Abcam, Cambridge, UK). The membrane was then incubated with a secondary antibody (Goat anti-Rabbit IgG, Bioswamp, 1:20,000) for 1 h. The gray value was detected after adding an ECL chemiluminescent solution (Millipore, Billerica, MA, USA) to the membrane.
Statistical analysis
Data are expressed as mean ± standard deviation (SD). A one-way analysis of variance followed by Tukey’s post-hoc test was used to assess the significance of the differences. p < 0.05 was considered statistically significant.
Results
Effects of sodium butyrate on kidney metabolism, glucose tolerance, and insulin resistance
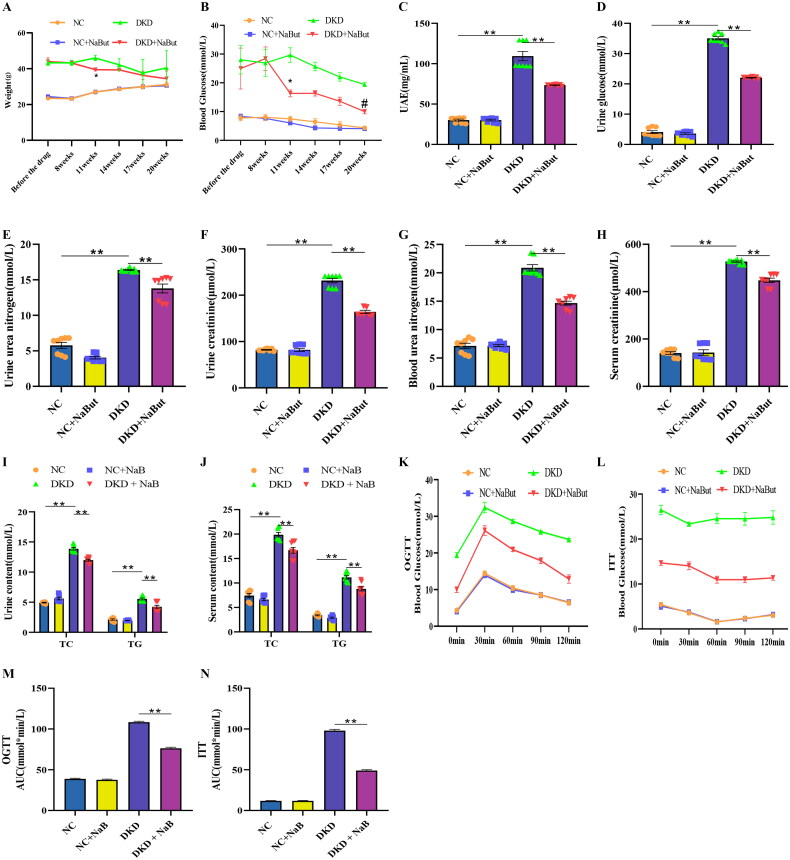
Throughout the experiment, NaBut had no significant effect on kidney metabolism, glucose tolerance, or insulin resistance in the db/m mice. However, in db/db mice, body weight and blood glucose levels were reduced after NaBut treatment (Figure 1A, B). To assess the effect of NaBut on kidney function, the levels of relevant indicators in the urine and serum were also measured. The results showed that the levels of glucose, BUN, Ucr, TG, TC, and UAE in the urine were significantly increased in db/db mice, and the levels of BUN, Ucr, TG, and TC in the serum were also significantly increased. After NaBut intervention, BUN, Ucr, TG, and TC levels of urine and serum, blood glucose, and UAE were reduced (Figure 1C–J). In addition, the OGTT and ITT results demonstrated that NaBut improved glucose tolerance and insulin resistance (Figure 1K–N).
Figure 1.
Effects of sodium butyrate (NaBut) on kidney metabolism, glucose tolerance, and insulin resistance. (A) The body weight after NaBut treatment in mice. (B) The levels of blood glucose after NaBut treatment in mice. (C) The levels of urine UAE after NaBut treatment in mice. (D) The levels of urine glucose after NaBut treatment in mice. (E) The levels of urine urea nitrogen after NaBut treatment in mice. (F) The levels of urine creatinine after NaBut treatment in mice. (G) The levels of blood urea nitrogen after NaBut treatment in mice. (H) The levels of serum creatinine after NaBut treatment in mice. (I) The urine content of triglyceride (TG) and total cholesterol (TC) after NaBut treatment in mice. (J) The serum content of TG and TC after NaBut treatment in mice. (K, M) Oral glucose tolerance test (OGTT) after NaBut treatment in mice. (L, N) Insulin tolerance test (ITT) after NaBut treatment in mice. **p < 0.01, group sizes = 8.
Gut microbiota analysis
In the heat map of cluster analysis, compared with the DKD group, Cupriavidus, AF12, [Prevotela], Mycoplasma, Alistipes, Prevotella, Parabacteroides, [Ruminococcus], Bacteroides and Pseudomonas were up-regulated in the DKD + NaBut group, Oscillospira, Dehalobacterium, Devosia, Sutterella, Clostridium, Neisseria, Shigella, Coprobacillus, Psychrobacter, Rickettsia, Bifidobacterium, Enterococcus, Paraprevotella, Akkermansia, Turicibacter, Corynebacterium, Candidatus_Arthromitus and Allobaculum were down-regulated in the DKD + NaBut group (Figure 2A). We found that the most important bacterial species in mice at the phylum level were Firmicutes and Bacteroidetes. We also found that the most important bacterial species in mice at the genus level were Desulfovibrio and Lactobacillus. Interesting, NaBut treatment significantly increased the abundance of Bacteroidetes phylum and Desulfovibrio genus, significantly decreased the abundance of Firmicutes phylum and Lactobacillus genus (Figure 2B, C).
Figure 2.
Gut microbiota analysis. (A) Heatmap of microbiota abundance after NaBut treatment in mice. (C) Top 20 phylum microbiota among groups after NaBut treatment in mice. (C) Top 20 genus microbiota among groups after NaBut treatment in mice. Group sizes = 8.
Effects of sodium butyrate on kidney tissue in mice
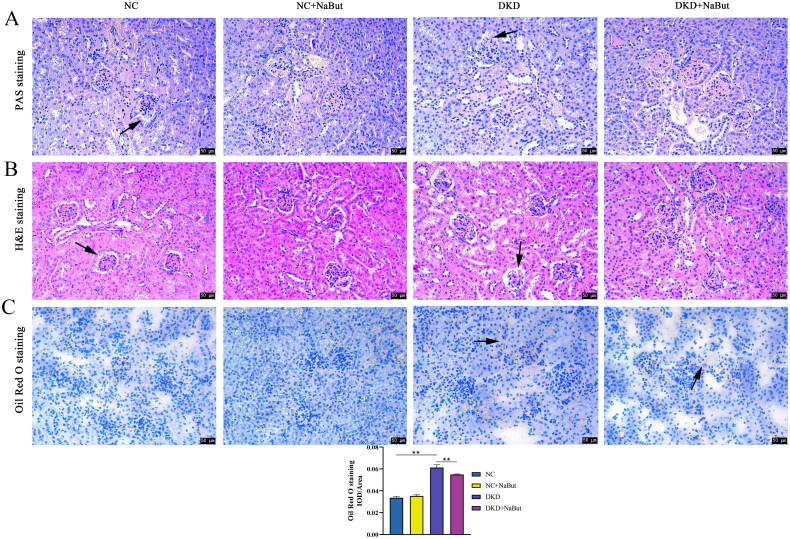
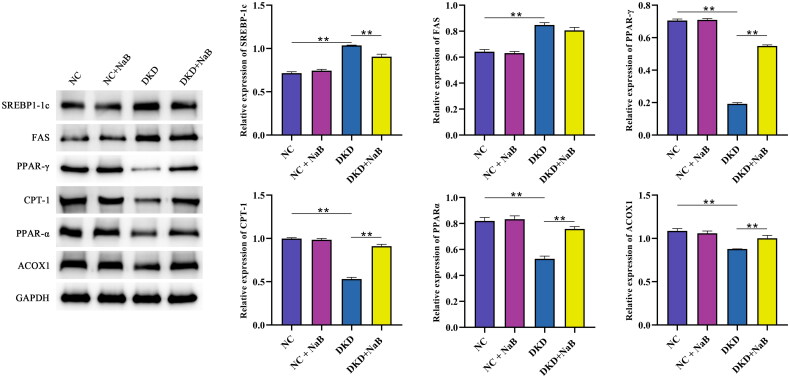
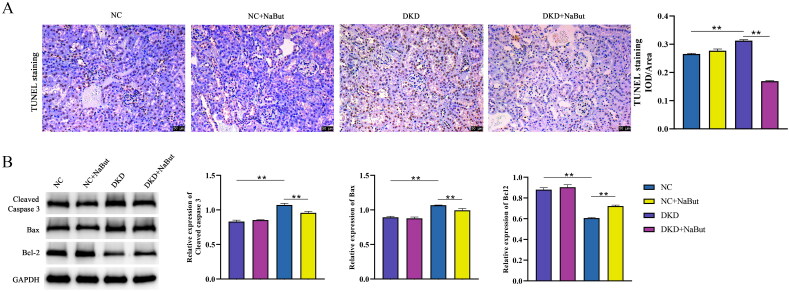
Kidney histopathology and morphology were evaluated by PAS staining and H&E staining. The results showed that no significant pathological changes were observed in db/m mice. In db/db mice, however, pathological sections showed a thickened basement membrane, matrix hyperplasia, epithelial cell necrosis, and infiltration of inflammatory cells. NaBut treatment significantly improved kidney pathological changes (Figure 3A, B). We then performed Oil Red O staining and found that db/db mice had significant lipid droplet accumulation and that NaBut significantly reduced red lipid droplets (Figure 3C). In addition, NaBut significantly decreased the expression of SREBP-1c and FAS and increased the expression of PPAR-γ, CPT-1, PPARα, and ACOX1 in db/db mice (Figure 4). This indicates that NaBut can improve lipid metabolism in db/db mice. TUNEL staining showed that NaBut reduced apoptosis of kidney tubular epithelial cells in db/db mice (Figure 5A). Meanwhile, the expression levels of cleaved caspase 3 and Bax decreased while the Bcl-2 level increased after NaBut treatment (Figure 5B).
Figure 3.
Effects of sodium butyrate (NaBut) on kidney histopathology, lipid metabolism, and apoptosis. (A) PAS staining. (B) H&E staining. (C) Oil Red O staining. Scale bar, 50 μm, **p < 0.01 group sizes = 8. Arrows represent thickened basement membrane, epithelial cell necrosis.
Figure 4.
Protein expression levels of SREBP-1c, FAS, PPAR-γ, CPT-1, PPARα, and ACOX1, **p < 0.01 group sizes = 8.
Figure 5.
Effects of sodium butyrate (NaBut) on apoptosis. (A) TUNEL staining. (B) Protein expression levels of cleaved caspase 3, Bax, and Bcl-2. Scale bar, 50 μm, **p < 0.01 group sizes = 8.
Effects of sodium butyrate on mitochondrial function and AMPK/PGC-1α signaling pathway in mice
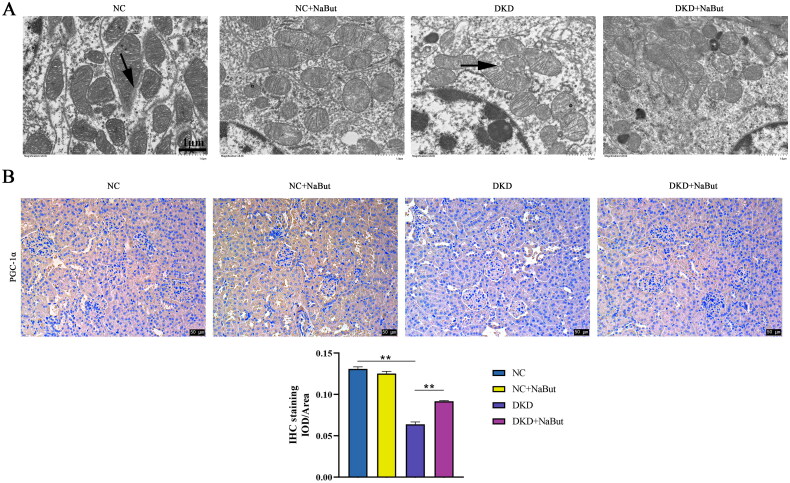
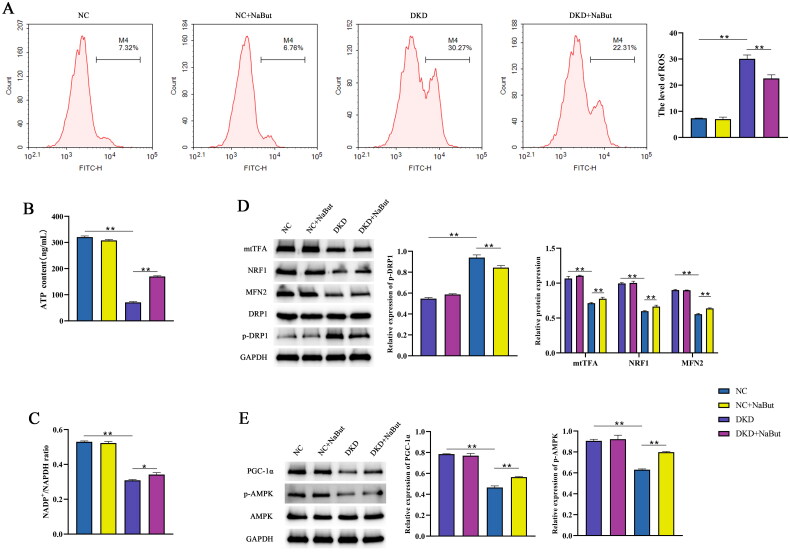
Compared with the NC group, the mitochondrial structure in the DKD group was incomplete, the membrane structure was destroyed, and the mitochondrial morphology was changed, compared with the DKD group, the mitochondrial basement membrane thickened with extensive pedicle fusion and the mitochondrial structure was intact in the DKD + NaBut group (Figure 6A). Immunohistochemical analysis showed that NaBut reversed the expression of PGC-1α in the kidneys of db/db mice (Figure 6B). Compared with DKD group, ATP content and NADP+/NADPH ratio were significantly increased and the level of ROS was significantly decreased in NC and DKD + NaBut groups. Whereas NaBut decreased ROS levels, increased ATP content, and NADP+ and NADPH levels (Figure 7A–C). Western blot results showed that compared with those in db/m mice, the expression levels of mtTFA, NRF1, and MFN2 in db/db mice were significantly decreased, and p-DRP1 expression was increased. NaBut treatment increased the expression levels of mtTFA, NRF1, and MFN2 and decreased p-DRP1 (Figure 7D). The protein expression levels of PGC-1α and p-AMPK were also significantly increased (Figure 7E).
Figure 6.
Transmission electron microscope and immunohistochemical analysis. (A) Mitochondrial ultrastructure, scale bar, 1 μm. (B) Immunohistochemical analysis of PGC-1α levels, scale bar, 50 μm. **p < 0.01, group sizes = 8.
Figure 7.
Effects of sodium butyrate (NaBut) on mitochondrial function and the AMPK/PGC-1-α signaling pathway in kidney tissues. (A) The levels of ROS after NaBut treatment in kidney tissues. (B) The contents of ATP after NaBut treatment in kidney tissues. (C) The levels of NADP+ and NADPH after NaBut treatment in kidney tissues. (D) The protein expression levels of mtTFA, NRF1, MFN2, DRP1, and p-DRP1 after NaBut treatment in kidney tissues. (E) The protein expression levels of PGC-1α, AMPK, and p-AMPK in kidney tissues. **p < 0.01, group sizes = 8.
Concentration screening and siRNA-PGC-1α transfection
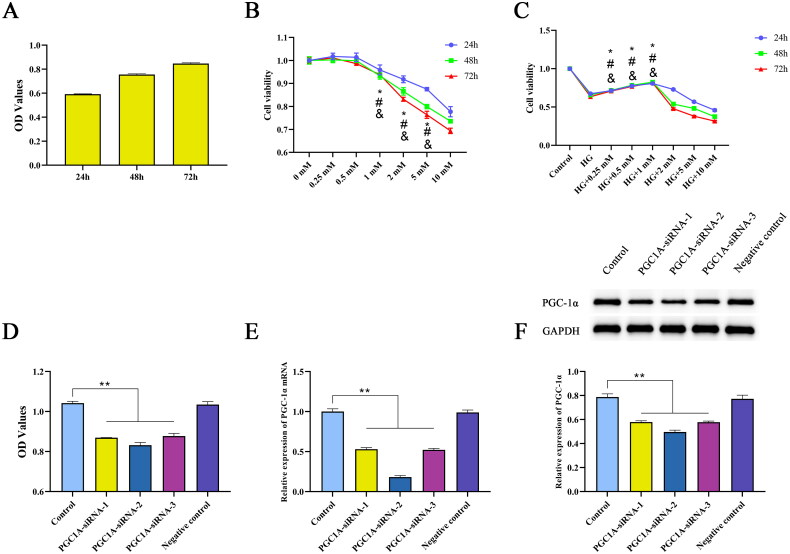
When HK-2 cells were incubated with 30 mM glucose for 24, 48, or 72 h, the cell viability increased with time. Therefore, the optimal time for constructing a DKD cell model was 24 h (Figure 8A). Treatment of HK-2 cells with different concentrations of NaBut for 24, 48, and 72 h decreased their viability in a concentration-dependent manner (Figure 8B). Subsequently, HK-2 cells were incubated with different concentrations of NaBut with 30 mM glucose, and the results showed that cell viability increased at 0.25, 0.5, and 1 mM (Figure 8C). NaBut was unable to overcome the high glucose-induced cell proliferation at intervention concentrations below 1 mM. This process mimicked the in vivo DKD model, and based on this experiment, it was determined that the effective concentration of NaBut in the cellular model needed to be greater than 1 mM. Therefore, the subsequent decrease in survival rate and increase in apoptosis are not contradictory, the intervention concentration of NaBut in the subsequent experiments is 1 mM. After transfection with siRNA-PGC-1α, the viability of HK-2 cells decreased, and the mRNA and protein expression of PGC-1α was significantly decreased, among which PGC-1α-siRNA-2 had the biggest effect (Figure 8D–F).
Figure 8.
Concentration screening and siRNA-PGC-1α transfection. Cell viability was evaluated by CCK-8 assay. (A) Cell viability of HK-2 cells incubated with 30 mM glucose for 24, 48, and 72 h. (B) Cell viability of HK-2 cells incubated with NaBut (0.25, 0.5, 1, 2, 5, 10 mM) for 24, 48, and 72 h, *p < 0.01 vs. the 0.5 mM group in 24 h, #p < 0.01 vs. the 0.5 mM group in 48h, &p < 0.01 vs. the 0.5 mM group in 72h. (C) Cell viability of DKD cell model incubated with NaBut (0.25, 0.5, 1, 2, 5, 10 mM) for 24, 48, and 72 h, *p < 0.01 vs. the HG group in 24 h, #p < 0.01 vs. the HG group in 48h, &p < 0.01 vs. the HG group in 72h. (D–F) Cell viability, mRNA and protein expression of PGC-1α following transfection with siRNA-PGC-1α HK-2 cells cultured with 5 mM glucose served as the control for all experiments. **p < 0.01, group sizes = 3.
Effect of sodium butyrate on proliferation and apoptosis in DKD cell model
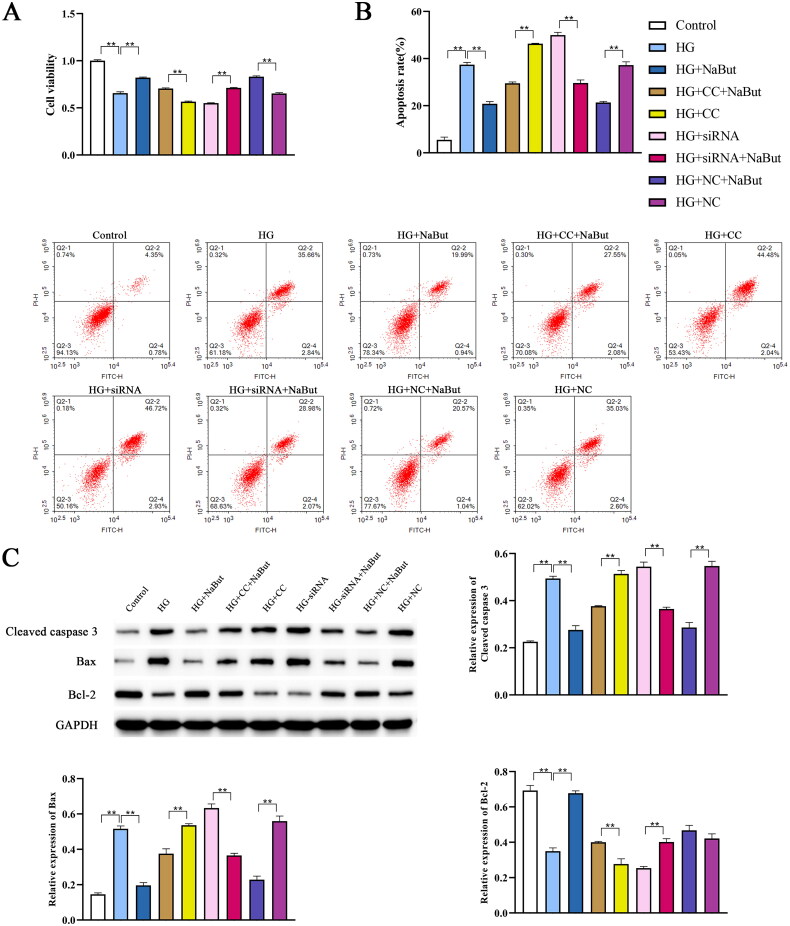
Compared to the control group, HK-2 cell viability was decreased in the HG (high glucose) group, the Cell viability of the CC and siRNA groups were lower than the HG group, however, after NaBut intervention, cell viability were increased (Figure 9A). The effect of NaBut on apoptosis was assessed by flow cytometry and western blotting. The results showed that the apoptosis rate of the HG group was higher than that of the control group, and the cell apoptosis rate significantly increased after inhibition of the AMPK/PGC-1α pathway by Compound C and siRNA-PGC. Following NaBut intervention, the apoptosis rate was significantly reduced. NaBut significantly reduced the protein expression of cleaved caspase 3 and Bax and increased Bcl-2 expression (Figure 9B, C).
Figure 9.
Effect of sodium butyrate (NaBut) on proliferation and apoptosis in DKD cell model. (A) Cell viability detected by CCK-8. (B) Cell apoptosis detected by flow cytometry. (C) Protein expression levels of cleaved caspase 3, Bax, and Bcl-2 detected by western blot. CC: AMPK inhibitor (Compound C), **p < 0.01, group sizes = 3.
Effect of sodium butyrate on mitochondrial function and AMPK/PGC-1α signaling pathway in DKD cell model
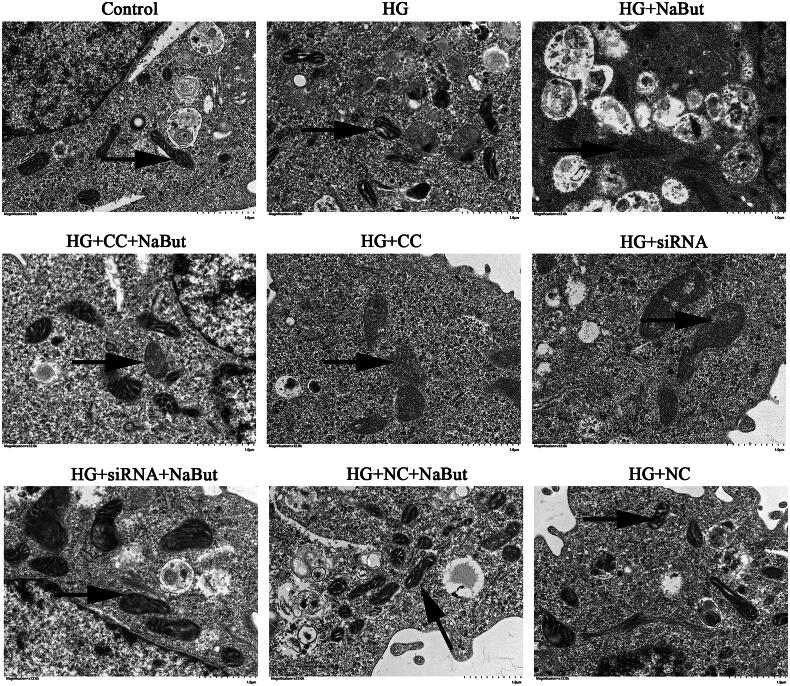
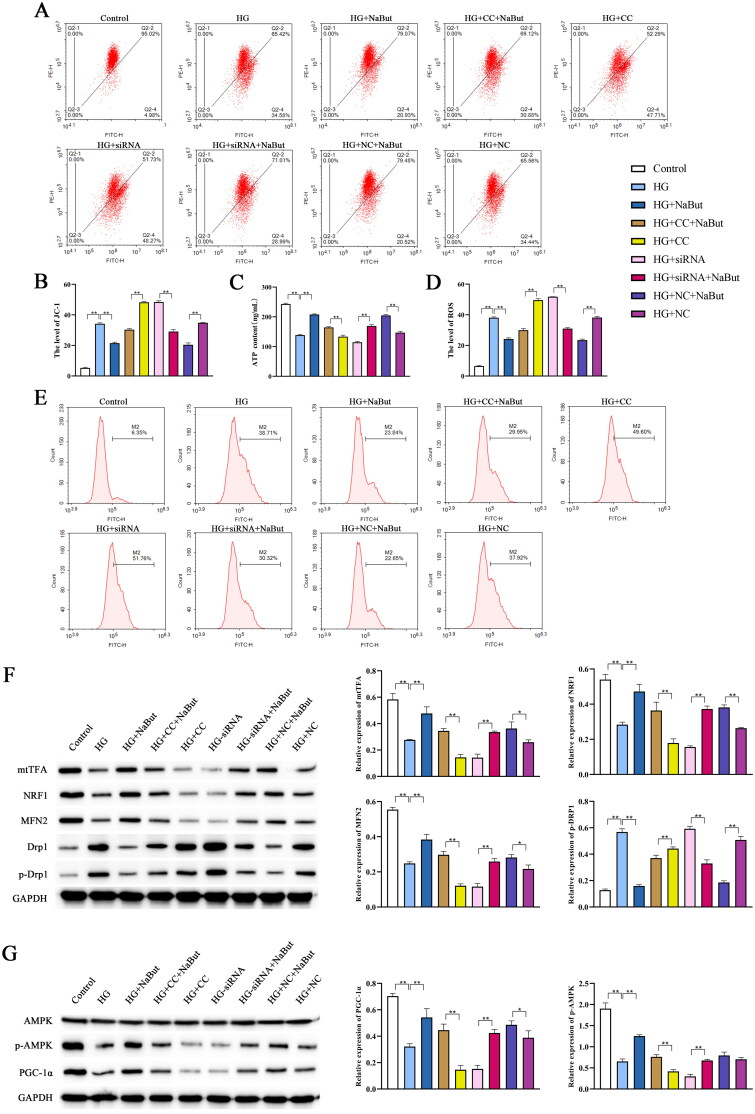
Transmission electron microscopy showed that compared with the control group, the mitochondria in HG group were deformed and the membrane structure was incomplete. Compared with the HG + CC group, mitochondrial deformation and membrane structure were improved in the HG + CC + NaBut group. Compared with the HG + siRNA group, mitochondrial deformation and membrane structure were improved in the HG + siRNA + NaBut group. In addition, the degree of mitochondrial damage in the HG + CC + NaBut group was less than that in the HG + CC group (Figure 10). These results suggest that NaBut not only participates in the repair of mitochondrial damage, but also reverses the effects of CC and siRNA, which also means that the mechanism of NaBut is related to the AMPK/PGC-1α pathway, because both CC and siRNA inhibit the expression of PGC-1α. The levels of ROS and JC-1 after treatment with HG were significantly higher than those in the control group, and the ATP content was significantly decreased. Compound C and siRNA-PGC aggravated the effects of the HG treatment. On the other hand, NaBut significantly decreased ROS and JC-1 levels and increased ATP content after treatment with high glucose, Compound C, and siRNA-PGC (Figure 11A–D). Meanwhile, NaBut increased the expression levels of mtTFA, NRF1, and MFN2 and decreased p-DRP1 (Figure 11F). In addition, NaBut increased the protein expression levels of PGC-1α and p-AMPK (Figure 11G).
Figure 10.
Mitochondrial ultrastructure in DKD cell model. Scale bar, 1 μm.
Figure 11.
Effect of sodium butyrate (NaBut) on mitochondrial function and AMPK/PGC-1-α signaling pathway in DKD cell model. (A, B) The mitochondrial membrane of JC-1 in DKD cell model. (C) The contents of ATP in DKD cell model. (D, E) The levels of ROS in DKD cell model (F) Protein expression levels of mtTFA, NRF1, MFN2, DRP1, and p-DRP1 in DKD cell model. (G) Protein expression levels of PGC-1α, AMPK, and p-AMPK were detected in DKD cell model. *p < 0.05, **p < 0.01, group sizes = 3.
Discussion
DKD is the most common and serious complication of type 2 diabetes mellitus and the most common cause of chronic kidney disease and end-stage kidney disease worldwide. DKD accounts for half of the patients undergoing kidney replacement therapy, imposing an enormous health and economic burden on society [21]. Long-term glucose and lipid metabolism disorders can lead to kidney filtration dysfunction. In our study, NaBut was shown to improve glucose tolerance and insulin resistance. Studies have shown that at least half of patients with type 2 diabetes will develop DKD, which is characterized by a sustained decrease in glomerular filtration rate, increased proteinuria, glomerular endothelial cell damage, podocyte loss, glomerular basement membrane thickening, and mesangial dilation [22]. Our study found that the phenomenon of glomerular endothelial cell damage, glomerular basement membrane thickening, and mesangial dilation in the kidney of DKD mice was alleviated after NaBut intervention.
Proteinuria can accelerate the deterioration of kidney function and is closely associated with the progression of kidney failure, end-stage kidney disease, and DKD. Our results showed that while the levels of urine glucose, BUN, Ucr, TG, TC, and UAE were increased in db/db mice, they were reduced following NaBut treatment. Patients with DKD exhibit dysbiosis of the gut microbiota, characterized by a decrease in short-chain fatty acid-producing flora and an increase in harmful substance-producing flora.
Short-chain fatty acids are particularly prominent in energy metabolism and have the potential to prevent and combat diseases related to metabolic abnormalities, such as obesity and type 2 diabetes. Data from clinical samples show that the levels of short-chain fatty acids in the plasma and feces of patients with chronic kidney disease are significantly lower, with the most significant change being butyrate [16]. In our study, we have shown that the microbial community diversity in db/db mice was reduced and that NaBut significantly increased the number of Bacteroidetes. A significant increase in intestinal Bacteroidetes by NaBut was found in both DKD model mice and NC mice。Butyrate is a major component of short-chain fatty acids after energy metabolism in DKD patients and a major product of fermented dietary fiber by Bacteroidetes. By analyzing the structural formula of NaBut, it can be found that the essence of NaBut is the substitution of H + at the carboxyl position of Butyrate, and therefore, after the metabolism of NaBut into DKD mice, Butyrate is produced after the disappearance of H+. This process requires the involvement of microorganisms in the gut, and therefore the abundance of intestinal Bacteroidetes increases in vivo at this time. Increased intestinal Bacteroidetes abundance implies increased metabolism of short-chain fatty acids, which would protect DKD mice, implying that NaBut plays an important role in regulating Bacteroidetes abundance to ameliorate DKD progression. Combined with the changes in the renal group in Figure 3 confirms this view. In addition, recent studies have found that sodium butyrate attenuates diabetic nephropathy in part through histone butyrylation modification [23]. The AMPK pathway is strongly associated with high-fat diet-induced diseases, yet changes in the AMPK pathway and increased abundance of Bacteroidetes were found behind the improvement of all these diseases [24,25].
Mitochondria are organelles found in eukaryotic cells that are the main sites of energy and ROS production [26]. High glucose levels induce excessive ROS production in the mitochondrial respiratory chain, which is the initiating factor of DKD. ROS in the kidneys with high glucose mainly originate from NADPH oxidase, which plays a decisive role in the occurrence of DKD [27,28]. When exposed to high glucose and high-fat environments for a long time, cells cannot effectively reduce the glucose transport rate to maintain intracellular glucose homeostasis, which leads to mitochondrial damage, resulting in ROS accumulation, oxidative stress in the mitochondria, and decreased ATP production and membrane potential. Increased mitochondrial permeability leads to apoptosis, which in turn exacerbates the progression of DKD [29]. Our results demonstrated that ROS levels increased, and ATP content, NADP+, and NADPH levels decreased in db/db mice, whereas NaBut treatment decreased ROS levels and increased ATP content, NADP+, and NADPH levels. MFN2 is a transmembrane protein in the mitochondrial outer membrane that plays an important role in the mitochondrial energy metabolism of cells, glucose level, cell proliferation, apoptosis, and autophagy [30]. NRF1, as a mitochondrial functional gene, plays an antioxidative role and protects cells from oxidative stress. It has been reported that NRF1 can activate the expression of mtTFA promoter, and overexpression of NRF1 and mtTFA can increase insulin sensitivity and reverse cellular damage [31]. DRP1 exists in the cytoplasmic matrix and is recruited by receptors on the mitochondrial outer membrane, thereby accelerating mitochondrial division in cells. Duan et al. found that Drp1 can bind to Bax, a carrier-binding protein essential for mitochondrial translocation. The change in its position affects the mitochondrial structure, accelerates the release of cytochrome C from the mitochondria, and activates the mitochondrial endogenous apoptosis pathway [32]. In our study, western blotting results showed that NaBut increased the expression levels of mtTFA, NRF1, and MFN2, and decreased p-DRP1. Meanwhile, the expression levels of cleaved caspase 3 and Bax decreased, and Bcl-2 levels increased after NaBut intervention, suggesting that NaBut can inhibit apoptosis and improve mitochondrial dysfunction in DKD.
The AMPK/PGC-1α signaling pathway is an important pathway that regulates energy metabolism in biological cells and is considered a key mechanism for regulating mitochondrial function, lipid metabolism, and cell growth [11]. AMPK, an intracellular energy sensor and regulator, is activated during cellular energy depletion and can restore energy homeostasis by phosphorylating key factors [33]. PGC-1α is a master regulator of mitochondrial biogenesis and plays a crucial role in coordinating mitochondrial biogenesis and metabolism-related gene signaling networks [34]. In hyperglycemia-induced ARPE-19 cells, lutein upregulates the expression of PGC-1α, NRF1, and TFAM by activating AMPK and downregulating ROS to maintain mtDNA integrity and mitochondrial biogenesis [35]. Our results demonstrated that NaBut reversed the expression levels of PGC-1α and p-AMPK in the kidneys of db/db mice. Activation of AMPK can downregulate the expression of SREBP-1c, thus inhibiting the synthesis of TG and fatty acids [36]. PPARα induces the expression of CPT-1, and AMPK activation can upregulate the expression of PPARα and CPT-1 to enhance mitochondrial utilization and fatty acid oxidation [37]. In our study, NaBut significantly decreased the expression levels of SREBP-1c and FAS and increased the expression levels of PPAR-γ, CPT-1, PPARα, and ACOX1 in db/db mice. This indicates that NaBut can improve lipid metabolism in db/db mice.
Reduced AMPK activity is associated with mitochondrial dysfunction [38]. Studies have found that high PGC-1α expression can increase ATP levels and reduce ROS levels. In addition, overexpression of PGC-1α can effectively inhibit oxidative stress-induced ROS production and apoptosis [39]. To further demonstrate the role of NaBut in the regulation of mitochondrial function through its impact on the AMPK/PGC-1-α signaling pathway, we used an AMPK inhibitor and transfected the siRNA-PGC-1α plasmid to intervene in high glucose-induced HK-2 cells. Our results showed that NaBut can reverse the effects of high glucose, Compound C, and siRNA-PGC treatment and improve mitochondrial dysfunction in DKD by activating the AMPK/PGC-1-α signaling pathway.
Conclusion
The in vitro and in vivo experiments demonstrated that NaBut can activate the kidney mitochondrial AMPK/PGC-1-α signaling pathway, thereby improving mitochondrial dysfunction in DKD. Furthermore, NaBut can regulating the gut microbial composition, thereby protecting kidney tissue. These results provide new insights into NaBut-targeted therapies for DKD.
Supplementary Material
Funding Statement
The authors declare that no funds, grants, or other support were received during the preparation of this manuscript.
Authors’ contributions
All authors contributed to the study conception and design. Material preparation, data collection and analysis were performed by [Yue Yu], [Yuan-Yuan Jia] and [Hong-Jun Li]. The first draft of the manuscript was written by [Yue Yu] and all authors commented on previous versions of the manuscript. All authors read and approved the final manuscript.
Disclosure statement
There are no conflicts of interest.
Ethics approval
This study was performed in line with the principles of the Declaration of Helsinki. Approval was granted by the Ethics Committee of Hubei Provincial Animal Management Commission (Date 6/2021/No SYXK(E)2018-0104).
Data availability statement
The data used to support the findings of this study are available from the corresponding author upon request.
References
- 1.Yuan CM, Nee R, Ceckowski KA, et al. . Diabetic nephropathy as the cause of end-stage kidney disease reported on the medical evidence form CMS2728 at a single center. Clin Kidney J. 2017;10(2):1–15. doi: 10.1093/ckj/sfw112. [DOI] [PMC free article] [PubMed] [Google Scholar]
- 2.Saeedi P, Petersohn I, Salpea P, et al. . Global and regional diabetes prevalence estimates for 2019 and projections for 2030 and 2045: results from the International Diabetes Federation Diabetes Atlas, 9th edition. Diabetes Res Clin Pract. 2019;157:107843. doi: 10.1016/j.diabres.2019.107843. [DOI] [PubMed] [Google Scholar]
- 3.Cui Y, Shi Y, Bao Y, et al. . Zingerone attenuates diabetic nephropathy through inhibition of nicotinamide adenine dinucleotide phosphate oxidase 4. Biomed Pharmacother. 2018;99:422–430. doi: 10.1016/j.biopha.2018.01.051. [DOI] [PubMed] [Google Scholar]
- 4.Bhargava P, Schnellmann RG.. Mitochondrial energetics in the kidney. Nat Rev Nephrol. 2017;13(10):629–646. doi: 10.1038/nrneph.2017.107. [DOI] [PMC free article] [PubMed] [Google Scholar]
- 5.Parikh SM, Yang Y, He L, et al. . Mitochondrial function and disturbances in the septic kidney. Semin Nephrol. 2015;35(1):108–119. doi: 10.1016/j.semnephrol.2015.01.011. [DOI] [PMC free article] [PubMed] [Google Scholar]
- 6.Zhan M, Brooks C, Liu F, et al. . Mitochondrial dynamics: regulatory mechanisms and emerging role in renal pathophysiology. Kidney Int. 2013;83(4):568–581. doi: 10.1038/ki.2012.441. [DOI] [PMC free article] [PubMed] [Google Scholar]
- 7.Zhan M, Usman IM, Sun L, et al. . Disruption of renal tubular mitochondrial quality control by myo-inositol oxygenase in diabetic kidney disease. J Am Soc Nephrol. 2015;26(6):1304–1321. doi: 10.1681/ASN.2014050457. [DOI] [PMC free article] [PubMed] [Google Scholar]
- 8.Honda T, Hirakawa Y, Nangaku M.. The role of oxidative stress and hypoxia in renal disease. Kidney Res Clin Pract. 2019;38(4):414–426. doi: 10.23876/j.krcp.19.063. [DOI] [PMC free article] [PubMed] [Google Scholar]
- 9.Li C, Matavelli LC, Akhtar S, et al. . (Pro)renin receptor contributes to renal mitochondria dysfunction, apoptosis and fibrosis in diabetic mice. Sci Rep. 2019;9(1):11667–11667. doi: 10.1038/s41598-019-47055-1. [DOI] [PMC free article] [PubMed] [Google Scholar]
- 10.Eo H, Park JE, Jeon Y-J, et al. . Ameliorative effect of ecklonia cava polyphenol extract on renal inflammation associated with aberrant energy metabolism and oxidative stress in high fat diet-induced obese mice. J Agric Food Chem. 2017;65(19):3811–3818. doi: 10.1021/acs.jafc.7b00357. [DOI] [PubMed] [Google Scholar]
- 11.Szrejder M, Piwkowska A.. AMPK signalling: implications for podocyte biology in diabetic nephropathy. Biol Cell. 2019;111(5):109–120. doi: 10.1111/boc.201800077. [DOI] [PubMed] [Google Scholar]
- 12.Hou S, Zhang T, Li Y, et al. . Glycyrrhizic acid prevents diabetic nephropathy by activating AMPK/SIRT1/PGC-1α signaling in db/db mice. J Diabetes Res. 2017;2017:2865912. doi: 10.1155/2017/2865912. [DOI] [PMC free article] [PubMed] [Google Scholar]
- 13.Li L, Ma L, Fu P.. Gut microbiota-derived short-chain fatty acids and kidney diseases. Drug Des Devel Ther. 2017;11:3531–3542. doi: 10.2147/DDDT.S150825. [DOI] [PMC free article] [PubMed] [Google Scholar]
- 14.Linh HT, Iwata Y, Senda Y, et al. . Intestinal bacterial translocation contributes to diabetic kidney disease. J Am Soc Nephrol. 2022;33(6):1105–1119. doi: 10.1681/ASN.2021060843. [DOI] [PMC free article] [PubMed] [Google Scholar]
- 15.Zhong C, Dai Z, Chai L, et al. Quantitative Reduction of Gut Microbiota-Derived Short-Chain Fatty Acids in Stool and Serum in Diabetic Kidney Disease; 2021. [DOI] [PMC free article] [PubMed] [Google Scholar]
- 16.Zhong C, Dai Z, Chai L, et al. . The change of gut microbiota-derived short-chain fatty acids in diabetic kidney disease. J Clin Lab Anal. 2021;35(12):e24062. [DOI] [PMC free article] [PubMed] [Google Scholar]
- 17.Huang W, Man Y, Gao C, et al. . Short-Chain fatty acids ameliorate diabetic nephropathy via GPR43-Mediated inhibition of oxidative stress and NF-κB signaling. Oxid Med Cell Longev. 2020;2020:4074832. doi: 10.1155/2020/4074832. [DOI] [PMC free article] [PubMed] [Google Scholar]
- 18.Dong W, Jia Y, Liu X, et al. . Sodium butyrate activates NRF2 to ameliorate diabetic nephropathy possibly via inhibition of HDAC. J Endocrinol. 2017;232(1):71–83. doi: 10.1530/JOE-16-0322. [DOI] [PubMed] [Google Scholar]
- 19.An L, Ji D, Hu W, et al. . Interference of Hsa_circ_0003928 alleviates high glucose-induced cell apoptosis and inflammation in HK-2 cells via miR-151-3p/Anxa2. Diabetes Metab Syndr Obes. 2020;13:3157–3168. doi: 10.2147/DMSO.S265543. [DOI] [PMC free article] [PubMed] [Google Scholar]
- 20.Akhtar S, Siragy HM.. Pro-renin receptor suppresses mitochondrial biogenesis and function via AMPK/SIRT-1/PGC-1α pathway in diabetic kidney. PLoS One. 2019;14(12):e0225728-e0225728. doi: 10.1371/journal.pone.0225728. [DOI] [PMC free article] [PubMed] [Google Scholar]
- 21.Koye DN, Shaw JE, Reid CM, et al. . Incidence of chronic kidney disease among people with diabetes: a systematic review of observational studies. Diabet Med. 2017;34(7):887–901. doi: 10.1111/dme.13324. [DOI] [PubMed] [Google Scholar]
- 22.De Cosmo S, Viazzi F, Pacilli A, et al. . Predictors of chronic kidney disease in type 2 diabetes: a longitudinal study from the AMD annals initiative. Medicine (Baltimore). 2016;95(27):e4007-e4007. doi: 10.1097/MD.0000000000004007. [DOI] [PMC free article] [PubMed] [Google Scholar]
- 23.Zhou T, Xu H, Cheng X, et al. . Sodium butyrate attenuates diabetic kidney disease partially via histone butyrylation modification. Mediators Inflamm. 2022;2022:7643322. doi: 10.1155/2022/7643322. [DOI] [PMC free article] [PubMed] [Google Scholar]
- 24.Ding X, Jian T, Li J, et al. . Chicoric acid ameliorates nonalcoholic fatty liver disease via the AMPK/Nrf2/NFκB signaling pathway and restores gut microbiota in high-fat-diet-Fed mice. Oxid Med Cell Longev. 2020;2020:9734560. doi: 10.1155/2020/9734560. [DOI] [PMC free article] [PubMed] [Google Scholar]
- 25.Xu Y, Wang N, Tan HY, et al. . Panax notoginseng saponins modulate the gut microbiota to promote thermogenesis and beige adipocyte reconstruction via leptin-mediated AMPKα/STAT3 signaling in diet-induced obesity. Theranostics. 2020;10(24):11302–11323. doi: 10.7150/thno.47746. [DOI] [PMC free article] [PubMed] [Google Scholar]
- 26.Du N, Xu Z, Gao M, et al. . Combination of ginsenoside Rg1 and astragaloside IV reduces oxidative stress and inhibits TGF-β1/smads signaling Cascade on renal fibrosis in rats with diabetic nephropathy. Drug Des Dev Ther. 2018;12:3517–3524. doi: 10.2147/DDDT.S171286. [DOI] [PMC free article] [PubMed] [Google Scholar]
- 27.Coughlan MT, Sharma K.. Challenging the dogma of mitochondrial reactive oxygen species overproduction in diabetic kidney disease. Kidney Int. 2016;90(2):272–279. doi: 10.1016/j.kint.2016.02.043. [DOI] [PubMed] [Google Scholar]
- 28.Mugabo Y, Zhao S, Lamontagne J, et al. . Metabolic fate of glucose and candidate signaling and excess-fuel detoxification pathways in pancreatic β-cells. J Biol Chem. 2017;292(18):7407–7422. doi: 10.1074/jbc.M116.763060. [DOI] [PMC free article] [PubMed] [Google Scholar]
- 29.Wen Y, Liu L, Xu Q, et al. . Knocking down Cabin1 induces glomerular podocyte injury. Int Urol Nephrol. 2018;50(5):983–991. doi: 10.1007/s11255-018-1787-z. [DOI] [PubMed] [Google Scholar]
- 30.Lin X, Huang H, Chen H, et al. . Advances in the regulation of mitochondrial dynamic changes by MFN2. China Medical Herald. 2019;16(13):42–45. [Google Scholar]
- 31.Xu C, Liu W-B, Zhang D-D, et al. . Benfotiamine, a lipid-soluble analog of vitamin B(1), improves the mitochondrial biogenesis and function in blunt snout bream (megalobrama amblycephala) fed high-Carbohydrate diets by promoting the AMPK/PGC-1β/NRF-1 axis. Front Physiol. 2018;9:1079–1079. doi: 10.3389/fphys.2018.01079. [DOI] [PMC free article] [PubMed] [Google Scholar]
- 32.Duan C, Kuang L, Xiang X, et al. . Drp1 regulates mitochondrial dysfunction and dysregulated metabolism in ischemic injury via Clec16a-, BAX-, and GSH- pathways. Cell Death Dis. 2020;11(4):251–251. doi: 10.1038/s41419-020-2461-9. [DOI] [PMC free article] [PubMed] [Google Scholar]
- 33.Herzig S, Shaw RJ.. AMPK: guardian of metabolism and mitochondrial homeostasis. Nat Rev Mol Cell Biol. 2018;19(2):121–135. doi: 10.1038/nrm.2017.95. [DOI] [PMC free article] [PubMed] [Google Scholar]
- 34.Zhang C-L, Feng H, Li L, et al. . Globular CTRP3 promotes mitochondrial biogenesis in cardiomyocytes through AMPK/PGC-1α pathway. Biochim Biophys Acta Gen Subj. 2017;1861(1 Pt A):3085–3094. doi: 10.1016/j.bbagen.2016.10.022. [DOI] [PubMed] [Google Scholar]
- 35.Nanjaiah H, Vallikannan B.. Lutein upregulates the PGC-1α, NRF1, and TFAM expression by AMPK activation and downregulates ROS to maintain mtDNA integrity and mitochondrial biogenesis in hyperglycemic ARPE-19 cells and rat retina. Biotechnol Appl Biochem. 2019;66(6):999–1009. doi: 10.1002/bab.1821. [DOI] [PubMed] [Google Scholar]
- 36.Ha J-H, Jang J, Chung S-I, et al. . AMPK and SREBP-1c mediate the anti-adipogenic effect of β-hydroxyisovalerylshikonin. Int J Mol Med. 2016;37(3):816–824. doi: 10.3892/ijmm.2016.2484. [DOI] [PubMed] [Google Scholar]
- 37.Ma G-P, Chen D, Chen H, et al. . Studies on mechanism of lipid metabolism regulation of citrus aurantium var.daidai flavonoids extract based on AMPK/SREBP-1 and PPARa pathway. Chin Tradit Herbal Drugs. 2021;52(21):6598–6608. [Google Scholar]
- 38.Joshi T, Singh AK, Haratipour P, et al. . Targeting AMPK signaling pathway by natural products for treatment of diabetes mellitus and its complications. J Cell Physiol. 2019;234(10):17212–17231. doi: 10.1002/jcp.28528. [DOI] [PubMed] [Google Scholar]
- 39.Ye J-X, Wang S-S, Ge M, et al. . Suppression of endothelial PGC-1α is associated with hypoxia-induced endothelial dysfunction and provides a new therapeutic target in pulmonary arterial hypertension. Am J Physiol Lung Cell Mol Physiol. 2016;310(11):L1233–L1242. doi: 10.1152/ajplung.00356.2015. [DOI] [PubMed] [Google Scholar]
Associated Data
This section collects any data citations, data availability statements, or supplementary materials included in this article.
Supplementary Materials
Data Availability Statement
The data used to support the findings of this study are available from the corresponding author upon request.


