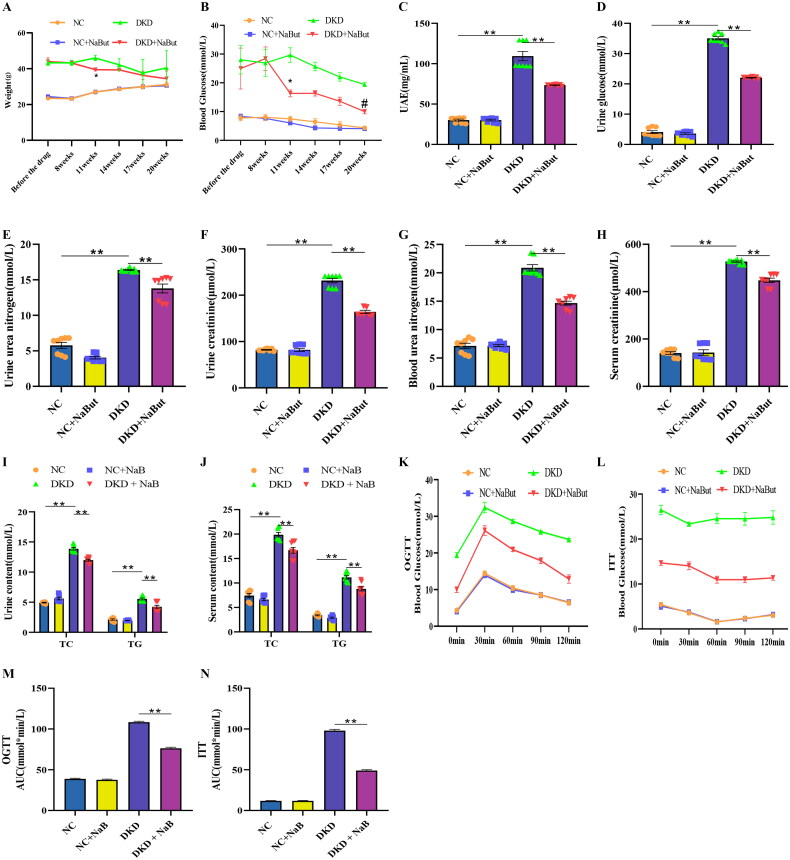
Figure 1.
Effects of sodium butyrate (NaBut) on kidney metabolism, glucose tolerance, and insulin resistance. (A) The body weight after NaBut treatment in mice. (B) The levels of blood glucose after NaBut treatment in mice. (C) The levels of urine UAE after NaBut treatment in mice. (D) The levels of urine glucose after NaBut treatment in mice. (E) The levels of urine urea nitrogen after NaBut treatment in mice. (F) The levels of urine creatinine after NaBut treatment in mice. (G) The levels of blood urea nitrogen after NaBut treatment in mice. (H) The levels of serum creatinine after NaBut treatment in mice. (I) The urine content of triglyceride (TG) and total cholesterol (TC) after NaBut treatment in mice. (J) The serum content of TG and TC after NaBut treatment in mice. (K, M) Oral glucose tolerance test (OGTT) after NaBut treatment in mice. (L, N) Insulin tolerance test (ITT) after NaBut treatment in mice. **p < 0.01, group sizes = 8.

