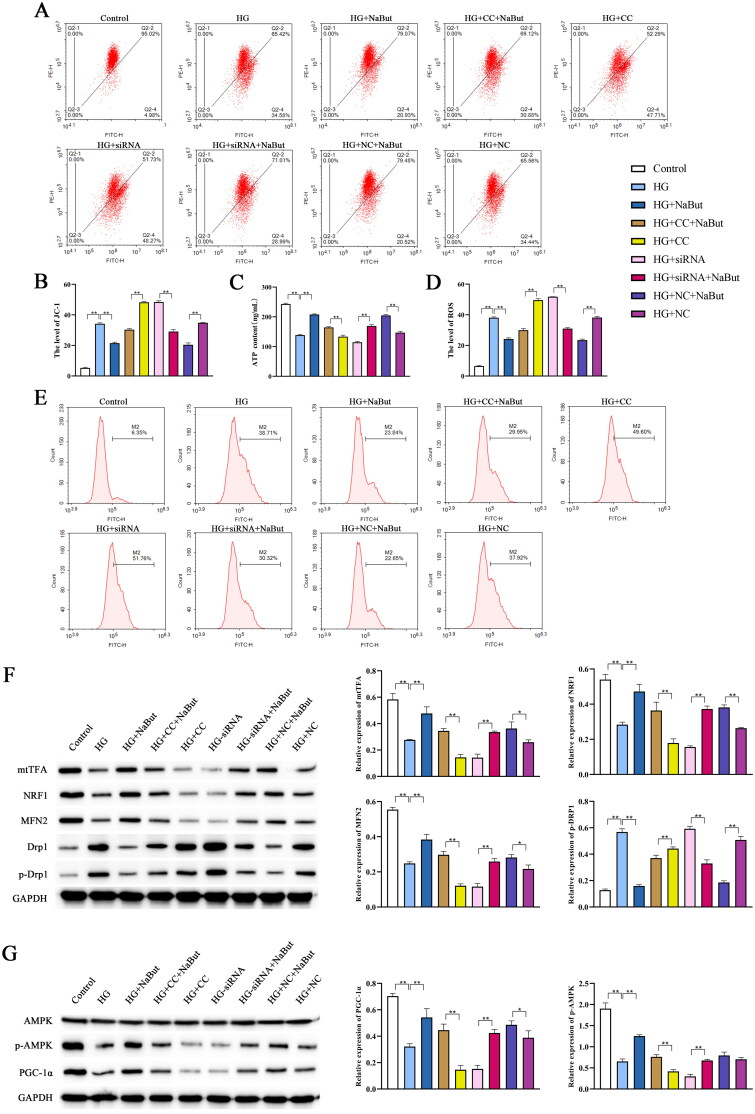
Figure 11.
Effect of sodium butyrate (NaBut) on mitochondrial function and AMPK/PGC-1-α signaling pathway in DKD cell model. (A, B) The mitochondrial membrane of JC-1 in DKD cell model. (C) The contents of ATP in DKD cell model. (D, E) The levels of ROS in DKD cell model (F) Protein expression levels of mtTFA, NRF1, MFN2, DRP1, and p-DRP1 in DKD cell model. (G) Protein expression levels of PGC-1α, AMPK, and p-AMPK were detected in DKD cell model. *p < 0.05, **p < 0.01, group sizes = 3.

