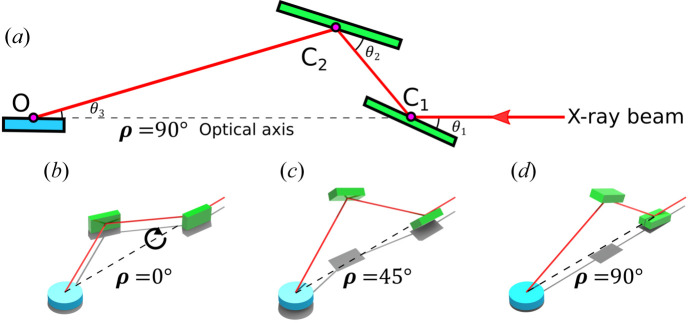
Figure 2.
(a) A geometric sketch of the side view (vertical plane) of the DCD crystal assembly and sample at ρ = 90°. (b) A 3D drawing of the DCD configuration corresponding to μ = 0° (i.e. ρ = 0°), (c) the intermediate situation when μ > 0° (0 < ρ < 90°) and (d) at maximum μmax (ρ = 90°), the situation corresponding to Fig. 1(a). The arrow in panel (b) shows the direction of rotation of the crystals around the optical axis ρ. The grey shapes in (b)–(d) are shadows of the drawn objects illuminated by artificial light from above.

