Fig. 1.

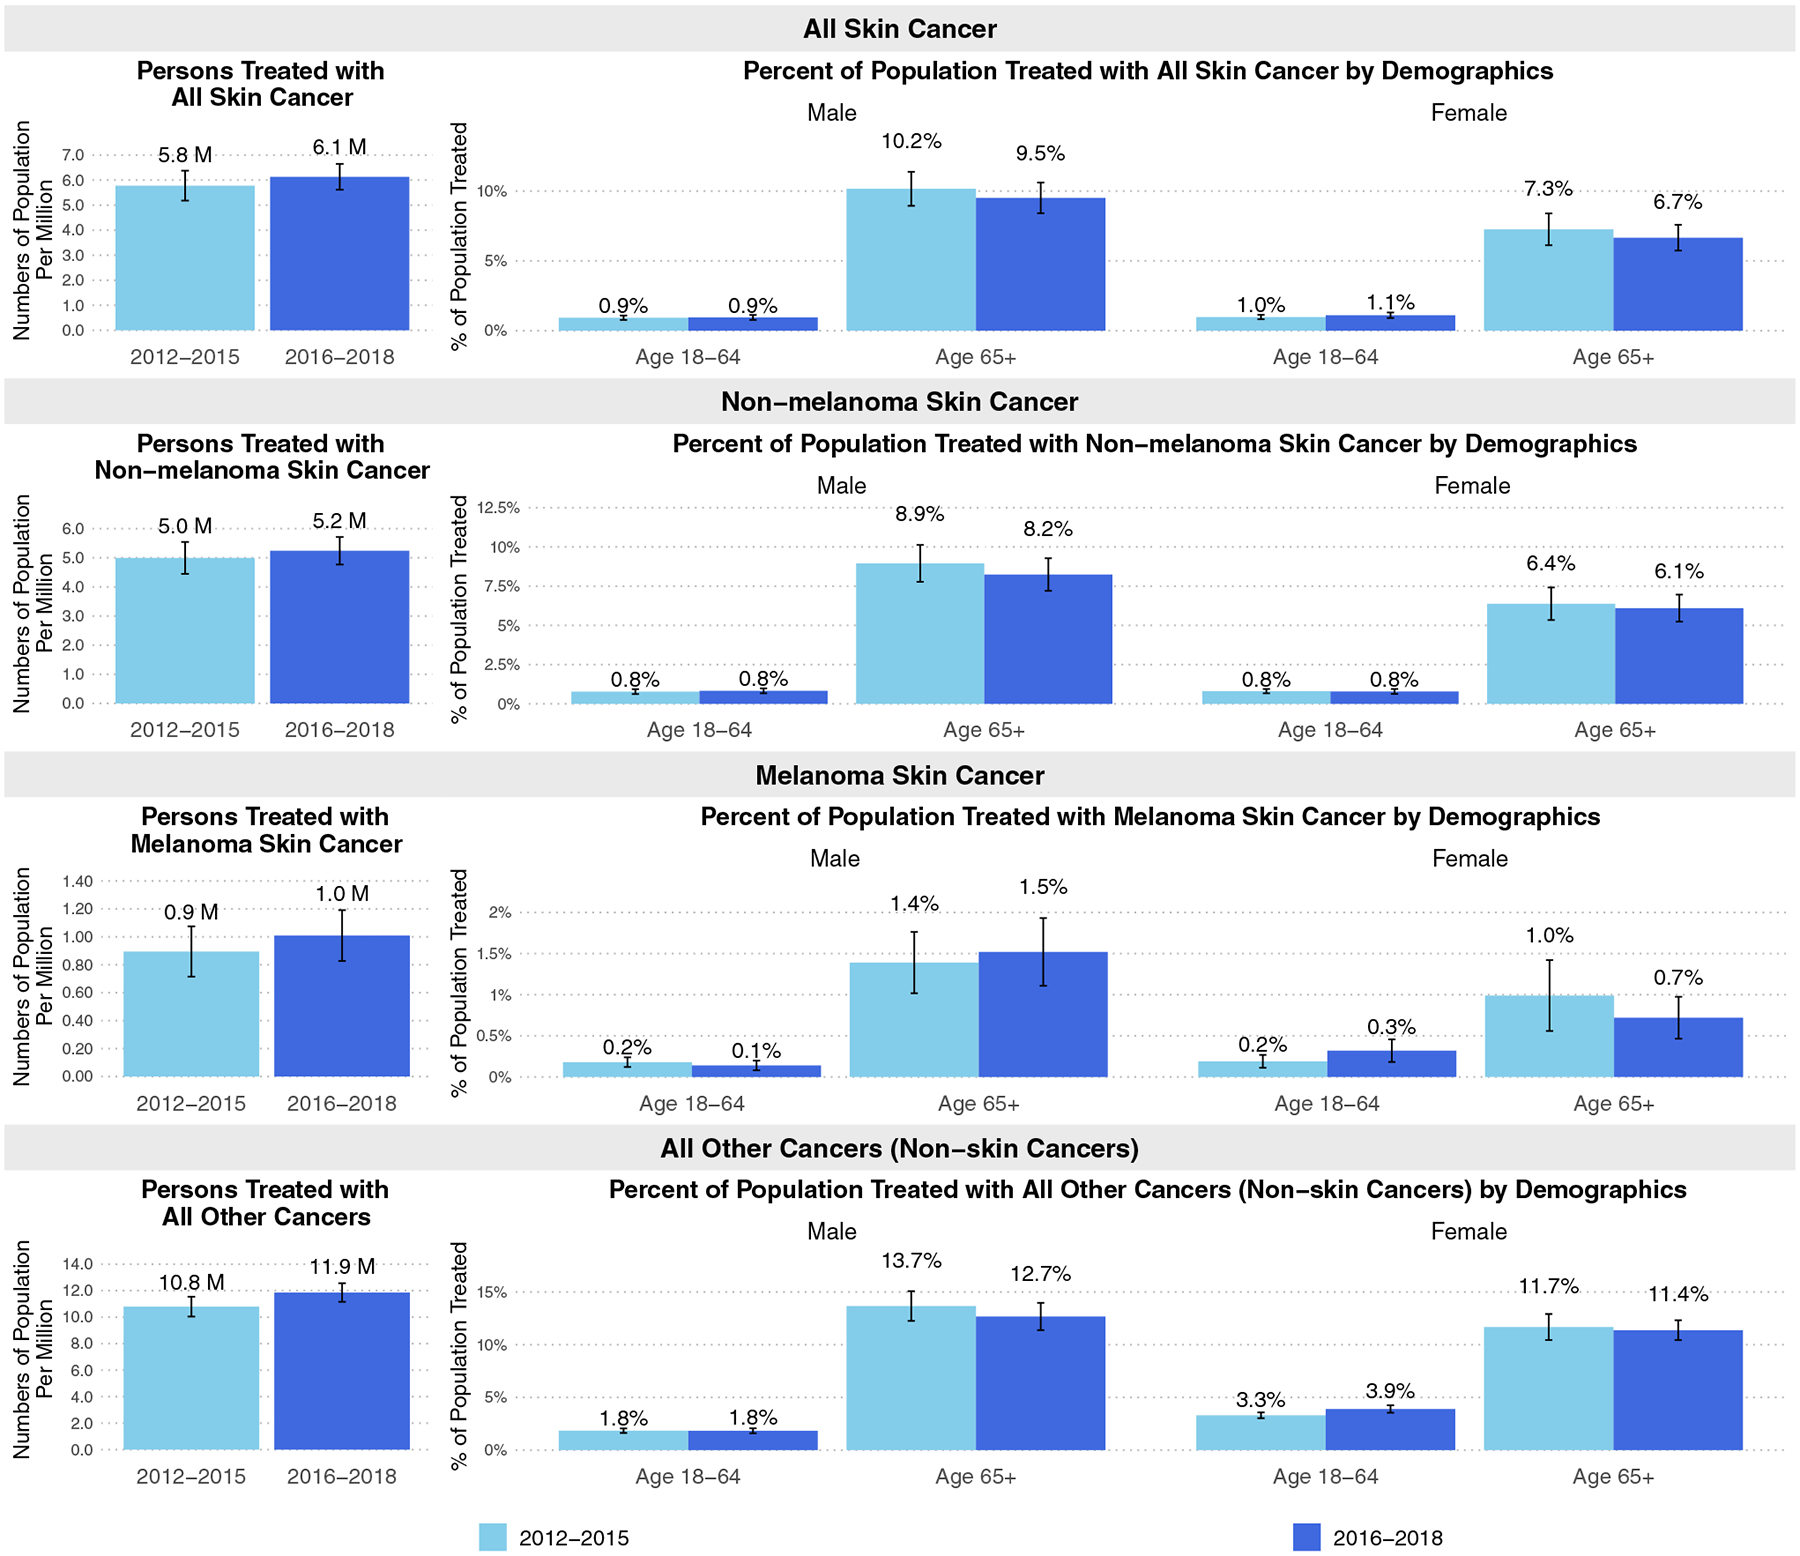
Average annual number of adults treated with skin and non-skin cancers in the USA 2012–18. The values represent the mean estimates, and the vertical bars represent the 95% confidence intervals. M indicates million

Average annual number of adults treated with skin and non-skin cancers in the USA 2012–18. The values represent the mean estimates, and the vertical bars represent the 95% confidence intervals. M indicates million