
Figure 1:
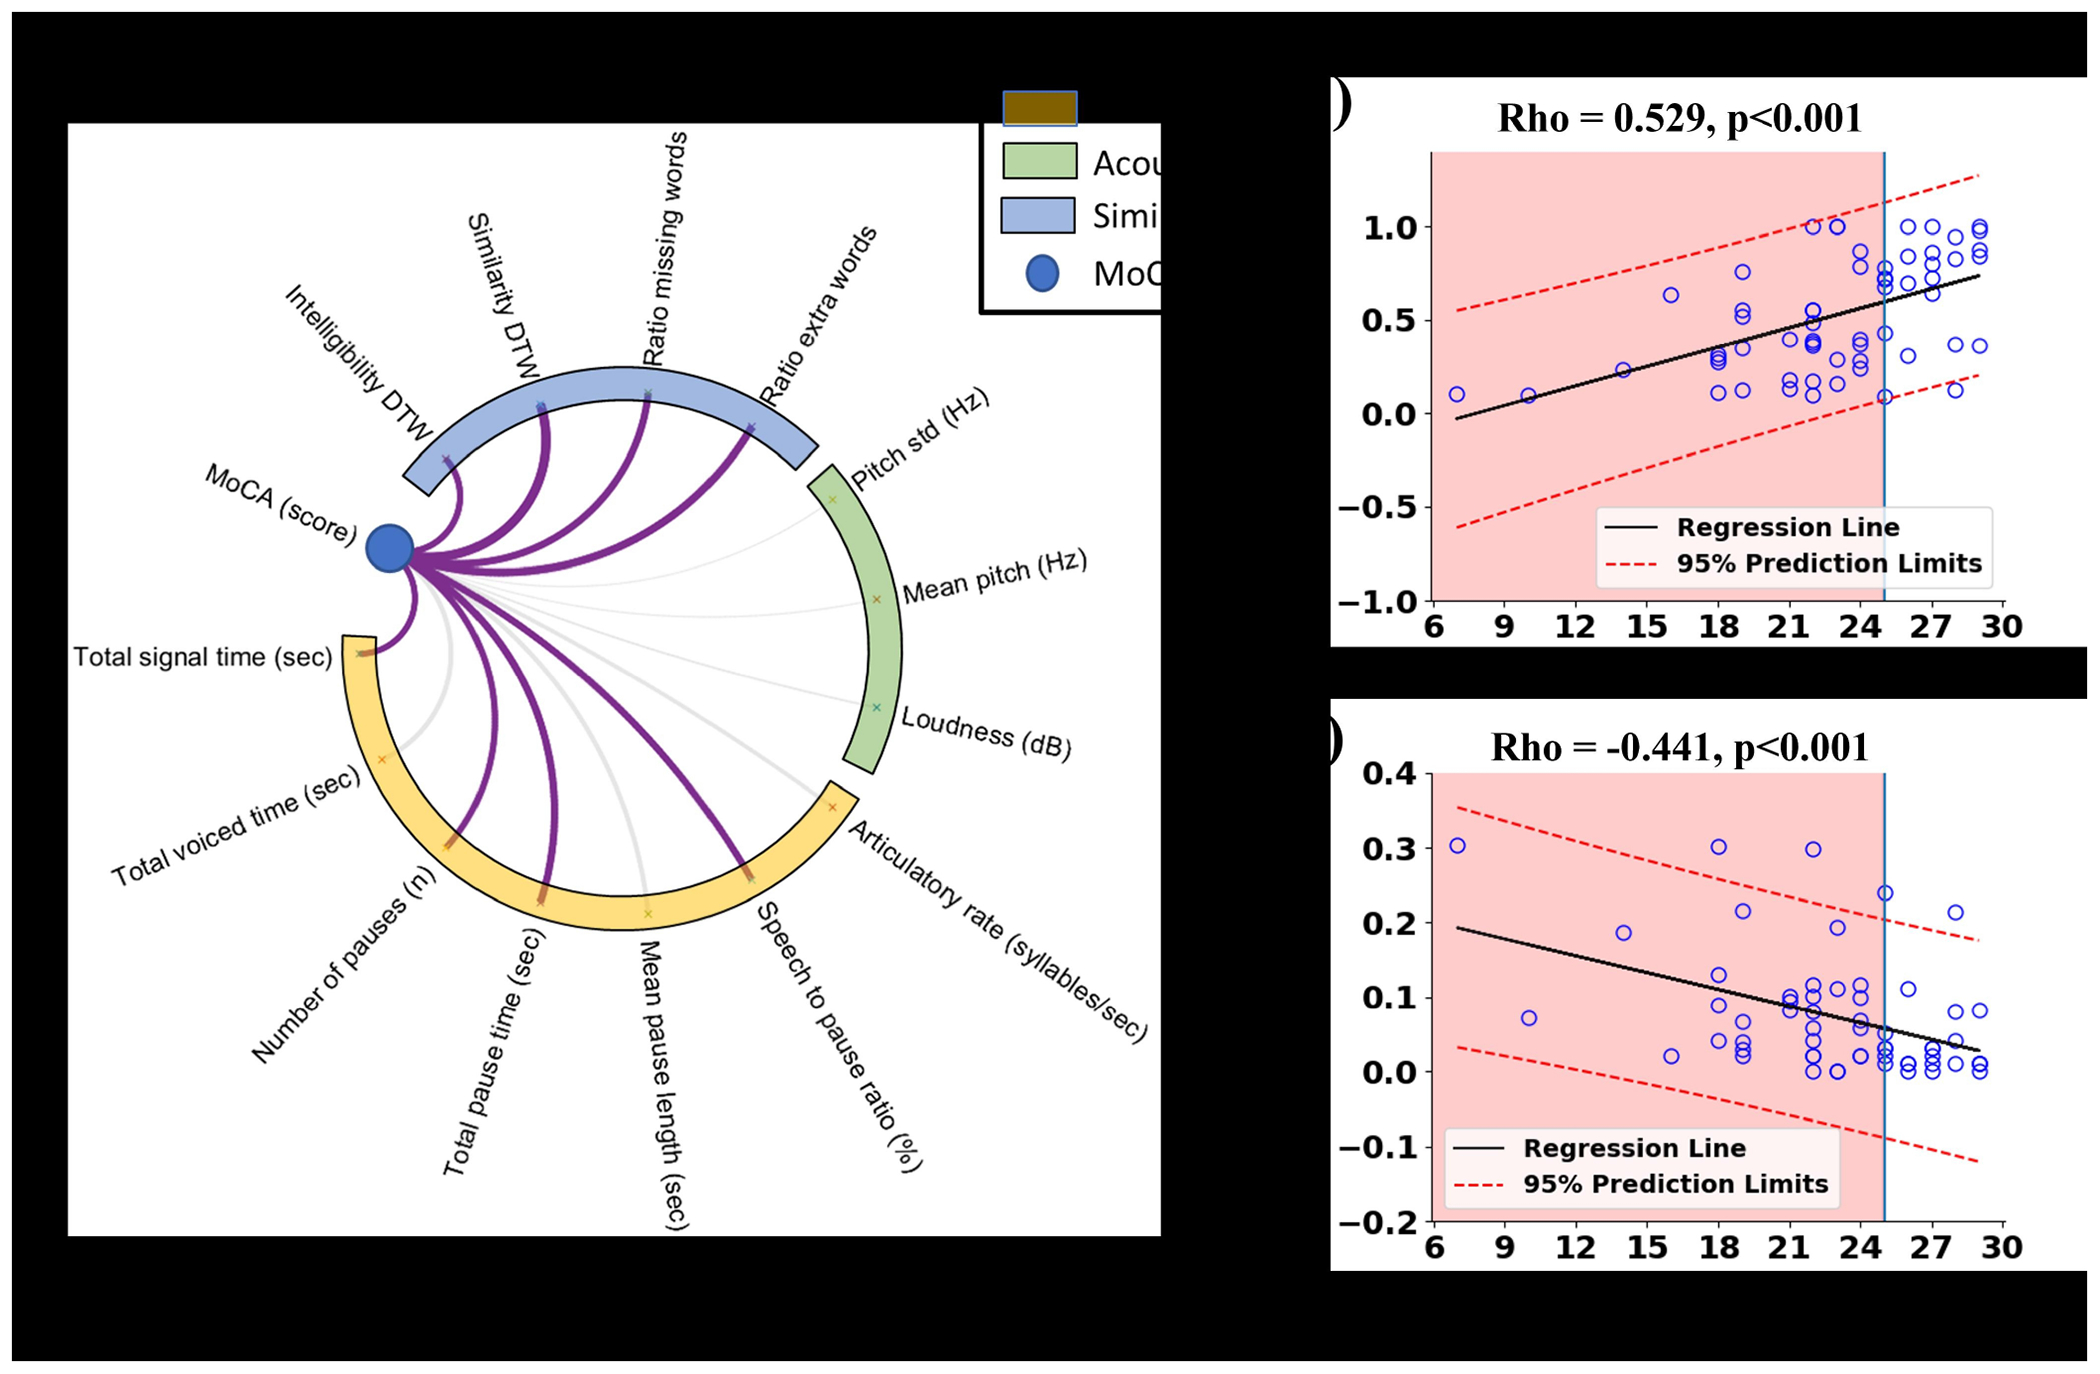
Correlation results between speech features and MoCA score: (a) is a correlation between MoCA and speech assessment parameters, purple lines indicate significant correlations and other lines are not significant; (b) and (c) are scatter plots exhibited