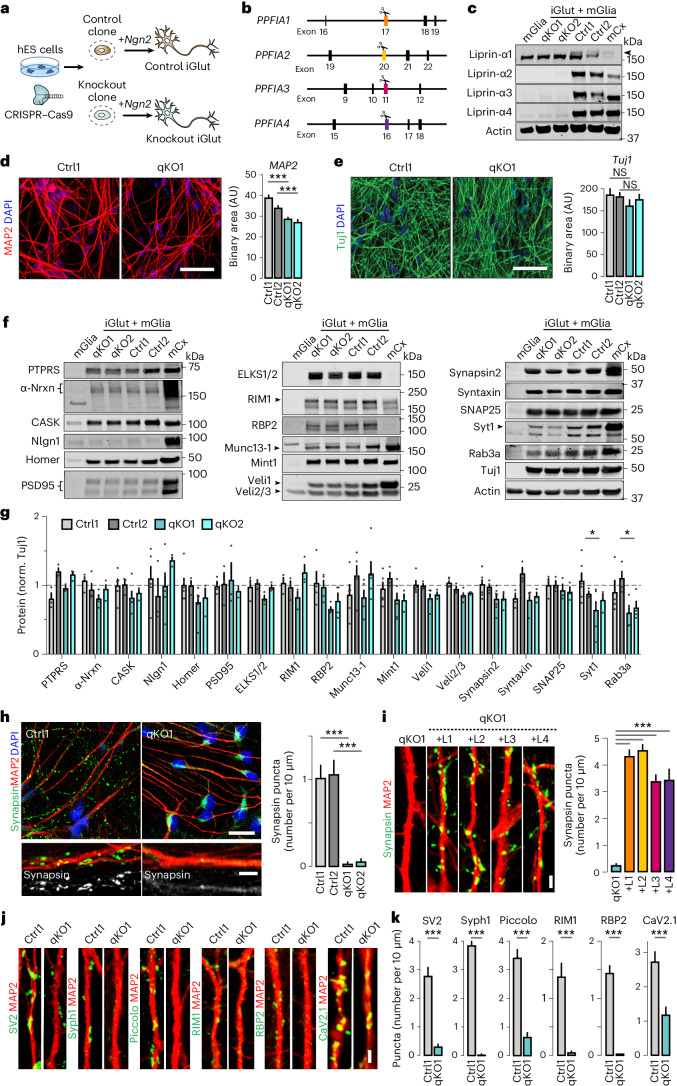
Fig. 1. Deletion of all liprin-α proteins in human neurons causes mislocalization of presynaptic proteins.
a, The experimental workflow. CRISPR–Cas9 was used to genetically delete all liprin-α proteins from hES cells, subsequently differentiated into iGluts by expression of Ngn2. b, A schematic of PPFIA1, PPFIA2, PPFIA3 and PPFIA4 genes (encoding liprin-α1, -α2, -α3 and -α4, respectively) with the targeted exons indicated. c, Immunoblots for liprin-α1, -α2, -α3 and -α4 of qKO clones and their isogenic controls. Mouse cortex and glia samples were included for reference. The arrowhead indicates neuronal liprin-α1. d,e, Dendritic (d) and axonal (e) densities in liprin-α control (Ctrl1 and Ctrl2) and knockout (qKO1 and qKO2) neurons, quantified via immunostaining for MAP2 (d) or Tuj1 (e). Left, representative images. Scale bar, 50 μm. Right, summary plots. Number of fields/batches, MAP2: Ctrl1, 84/3; Ctrl2, 94/3; qKO1, 94/3; qKO2, 80/3 and Tuj1: Ctrl1, 27/3; Ctrl2, 18/3; qKO1, 20/3; qKO2, 21/3. f,g, Western blots of synaptic proteins in liprin-α knockout (qKO) or control (Ctrl) iGluts, mouse glia (mGlia) and mouse cortex tissue (mCx). Representative blots (f) and summary graphs (g) of quantifications normalized to Tuj1 (norm. Tuj1). Dashed line indicates the average value of controls. Syt1, synaptotagmin-1; RBP2, RIM-BP2. Number of cells/batches: n = 3–7 (Supplementary Table 1). h, Synapsin distribution in liprin-α Ctrl and qKO human iGluts stained for MAP2 (red), synapsin (green) and 4,6-diamidino-2-phenylindole (DAPI) (blue). Left, representative images at low and high magnification, respectively. Right, a summary plot of synapsin puncta density. Number of fields/batches: Ctrl1, 24/2; Ctrl2, 22/2; qKO1, 30/2; qKO2, 28/2. Scale bars, 20 μm (overviews) and 5 μm (inserts). i, Rescue of synapsin puncta in liprin-α knockout neurons. Left, representative images of liprin-α knockout (qKO) iGluts, and qKO rescued with liprin-α1 (+L1), liprin-α2 (+L2), liprin-α3 (+L3) and liprin-α4 (+L4). Scale bar, 2 μm. Right, summary graphs of synapsin puncta densities. Number of cells/batches: qKO1, 57/4; qKO1 + L1, 62/4; qKO1 + L2, 66/4; qKO1 + L3, 64/4, qKO1 + L4, 32/2. j,k, Distribution of synaptic vesicle glycoproteins 2 (SV2), Syph1 (synaptophysin-1), piccolo, RIM1, RIM-BP2 and CaV2.1 in liprin-α control (Ctrl) and knockout (qKO) neurons. Representative images (j) of the indicated protein (green) and MAP2 (red) and summary plots of puncta densities (k). Scale bar, 2 μm. Number of fields/batches: Ctrl1, 28–67/2–3 and qKO1, 20–54/2–3 (Supplementary Table 1). Data are represented as means ± s.e.m. NS, not significant; *P < 0.05; and ***P < 0.001.

