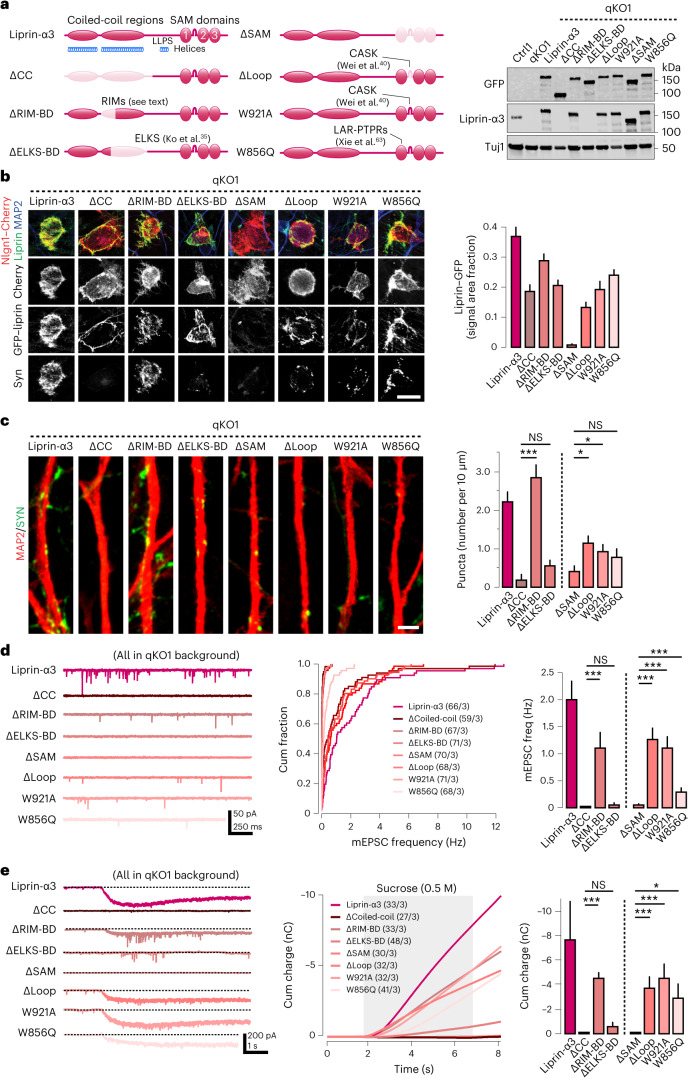
Fig. 5. Molecular dissection of liprin-α qKO phenotypes.
a, Left, schematics of liprin-α3 domain structure and the location and nature of the mutations introduced in different rescue constructs (light red). The name assigned to each rescue construct is shown on the left and references to studies originally describing the mutations are highlighted (see text for details). Right, the expression of all GFP-tagged mutant constructs assessed by western blot, using either anti-GFP or anti-liprin-α3 antibodies. b, Recruitment of liprin-α3 mutants to artificial synapses formed onto Nlgn1-expressing HEK cells cocultured with knockout (qKO) iGluts. Left, representative images of the indicated GFP-tagged mutant constructs. Right, summary quantifications of liprin-α3 recruitment. Scale bar, 20 μm. Number of cells/batches: 50–127/1 (Supplementary Table 1). c, Rescue of synapsin puncta by different liprin-α mutant constructs expressed in qKO iGluts. Left, representative images of iGluts immunolabeled for MAP2 (red) and synapsin (green). Scale bar, 2 μm. Right, summary plots of synapsin puncta density upon rescue with the different liprin-α mutant constructs. Number of cells/batches: liprin-α3 (WT), 25/2; ΔCC, 22/2; ΔRIM-BD, 25/2; ΔELKS-BD, 29/2; ΔSAM, 24/2; Δloop, 26/2; W921A, 26/2; and W856Q, 30/2. d, Rescue of spontaneous glutamatergic transmission by expression of different liprin-α mutant constructs expressed in qKO iGluts. Representative traces (left), cumulative distributions of miniature EPSC frequencies (middle) and summary plots (right). e, The effects of liprin-α mutants on hyperosmotic sucrose responses. Representative traces (left), integrated responses (middle) and summary plots (right) of responses in qKO neurons expressing the different liprin-α mutants. Shaded area indicates time of sucrose application. Data are represented as means ± s.e.m. NS, not significant; *P < 0.05; and ***P < 0.001.

