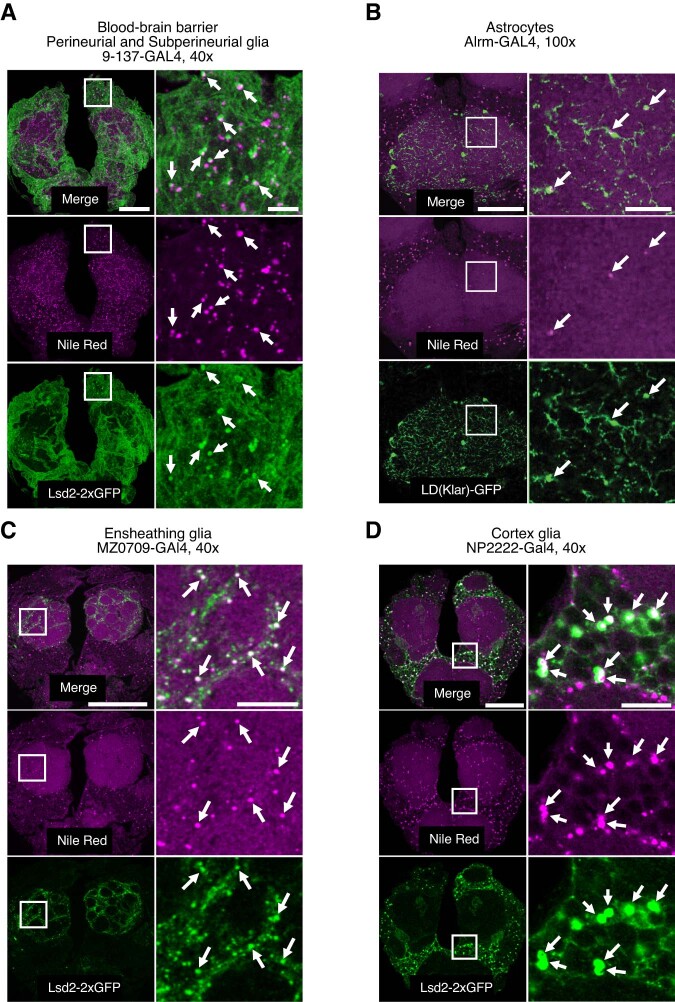
Extended Data Fig. 3. Lipid droplets in the Drosophila brain are localized primarily to cortex and ensheathing glia.
Glial subset-specific GAL4 lines were used to express the LD-GFP or Lsd2-GFP, and brains were stained with the lipophilic dye, Nile Red. Colocalization of subset-specific LD/Lsd2-GFP puncta with Nile-red stained lipid droplets was taken as indication of the capacity for lipid droplet formation within a given glial subset. (A) Blood-brain barrier (BBB) glia encompassing the perineurial and subperineurial populations (9-137-GAL4), contain a small number of lipid droplets. Generally, no more than ~20 lipid droplets per brain could be observed in the BBB and counts did not appear to be obviously altered by a night of sleep deprivation. (n = 9 non-deprived and n = 9 sleep-deprived brains). In order to illustrate the presence of BBB lipid droplets, the images shown are a maximum projection of 3-confocal Z-planes showing an unusually dense region of BBB lipid droplet expression. (B) Astrocytes expressing LD-GFP in the Alrm-GAL4 expression pattern form only a few, sparse lipid droplets (n = 3 brains). The region shown is of the subesophageal area of the central brain (100x magnification). Other neuropil areas exhibited a similar sparseness of astrocytic lipid droplets. (C) Ensheathing glia (MZ0709-GAL4) contain large numbers of very small lipid droplets. The majority of Nile-Red stained lipid droplets within neuropil regions appear to localize to neuropil compartment boundaries where ensheathing glia are located, as shown here surrounding antennal lobe glomeruli. (n = 10/10 brains imaged). (D) Cortex glia (NP2222-GAL4) contain a high density of larger lipid droplets. Nearly all Nile-Red-stained lipid droplets outside of neuropil regions localize to cortex glia. (n = 8/8 brains imaged). For all images, the central brain is shown on the left with a white box indicating the enlarged region shown on the right. Scale bars at left are 50uM each and at right (enlarged) are 10uM each. The bottom panel of each group of images shows Lsd2/LD-GFP expression driven by the respective GAL4, the central panel shows Nile Red staining of the same brain/z-slice and the top panel shows a merge of the green and red channels. Arrows mark the locations of representative lipid droplets. All images were acquired with sequential imaging of red and green excitation/emission to prevent any bleed-through between channels.

