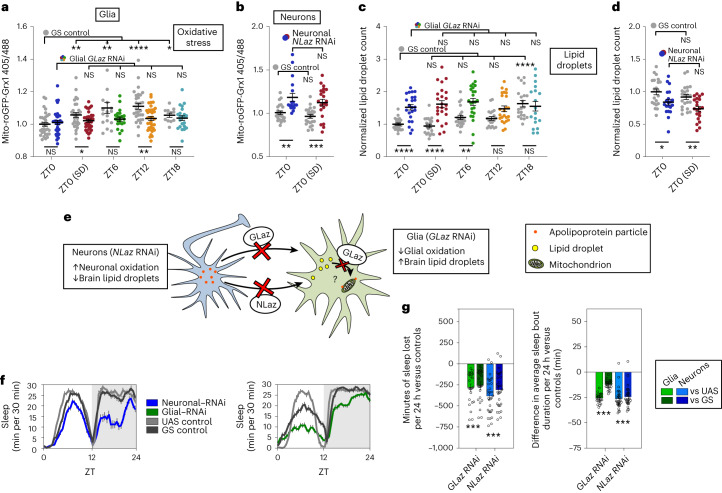
Fig. 3. Adult-specific knockdown of lipid transport genes in neurons or glia causes sleep loss, alters cell-type-specific mitochondrial oxidation and impairs glial lipid droplet processing.
a–d, Oxidative stress (mito-roGFP-Grx1; a and b) and lipid droplets (c and d) in glia (left) and neurons (right). The experimental GS>RNAi genotypes are shown in time point-specific colors (as in Fig. 1a), whereas the GS control genotypes are in gray. e, Schematic illustrating the effects of neuronal NLaz RNAi or glial GLaz RNAi on mito-roGFP2-Grx1 oxidation in neurons and glia, respectively, or on brain lipid droplets. Increased lipid droplets with glial GLaz RNAi suggests that GLaz may play an additional role in the delivery of lipids to mitochondria for breakdown. f, Total sleep (30-min bins) is reduced with adult-specific knockdown of NLaz in neurons (left) or GLaz in glia (right). Gray shading indicates the dark period. g, Adult-specific knockdown of the lipid transport genes GLaz in glia (green) or NLaz in neurons (blue) results in sleep loss (left) and reduced sleep bout duration (right). Sleep loss is represented as sleep of the experimental genotype minus the average sleep of each of the control groups (UAS or GS). repo-GS; Dcr with/without GLaz RNAi (V15389) and nSyb-GS; Dcr with/without NLaz RNAi (V35558) were used for all glial and neuronal experiments, respectively, in this figure along with mito-roGFP-Grx1 in non-sleep experiments. For a–d, statistical differences across time points and within genotype are shown above the plotted points, whereas differences between experimental and control genotypes at each time point are shown below. For all data, bars/error bars indicate mean and s.e.m., respectively, where error due to subtraction between groups in sleep data has been propagated in the s.e.m. bars shown. Data points indicate individual flies/brains. For all data shown, *P < 0.05, **P < 0.01, ***P < 0.001 and ****P < 0.0001, while some groups with P > 0.05 (not significant) are unmarked. The following are the numbers of flies (n) as plotted from left to right and statistical tests used: n = 33, 30, 33, 33, 21, 21, 33, 33, 14 and 21; ZT0/ZT6/ZT12/ZT18, Kruskall–Wallis test with a Dunn’s multiple testing correction; ZT0/ZT0 SD (all comparisons), Mann–Whitney test (two tailed) except GS versus GS RNAi, which was analyzed by an unpaired two-tailed t-test (a); n = 22, 18, 22 and 21 (all comparisons), Mann–Whitney test (two tailed) except ZT0/ZT0 SD (GS versus GS), which was analyzed by an unpaired t-test (two tailed; b); n = 21, 23, 20, 24, 22, 24, 20, 24, 21 and 18; ZT0/ZT6/ZT12/ZT18, Kruskall–Wallis test with a Dunn’s multiple testing correction; ZT0/ZT0 SD (all comparisons), unpaired two-tailed t-test except ZT0/ZT0 SD (GS versus GS RNAi), which was analyzed by a two-tailed Mann–Whitney test (c); n = 21, 20, 22 and 21, all unpaired two-tailed t-test (d); n = 25, 25, 31 and 31, all Mann–Whitney test (two tailed; f and g).

