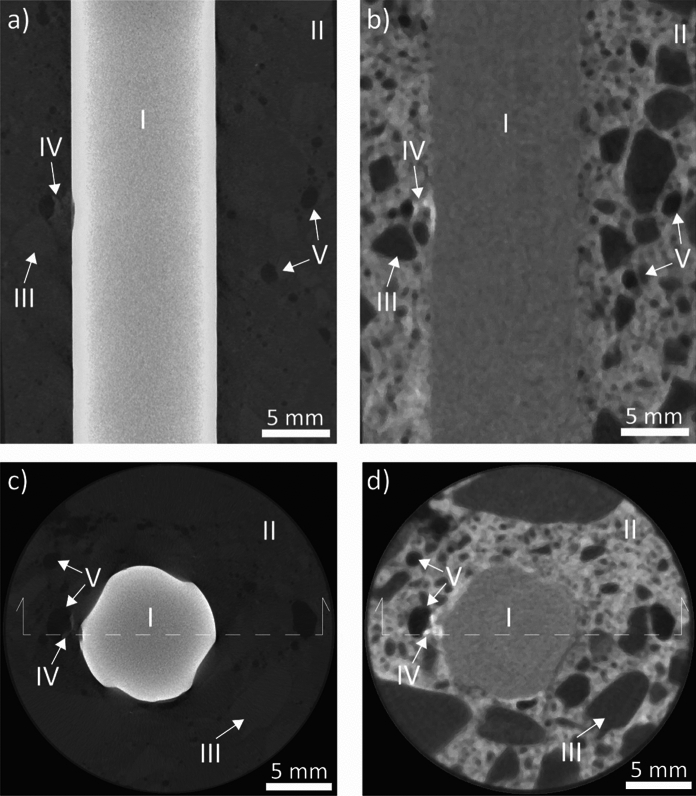
Fig. 2.
Comparison of reconstructed sections of the two imaging modes X-ray (a, c) and neutrons (b,d), illustrating the pronounced differences in attenuation (grey level) between the two modes for different phases, such as the rebar (I), cementitious phases (II), aggregates (III), corrosion products (IV), and voids (V). The dotted lines visible in the horizontal slices of X-rays and neutron images, respectively, indicate the cross-section lines of the respective vertical images. Image analysis and detection of components were conducted on high-resolution data, of which image quality may differ from the one herein visible

