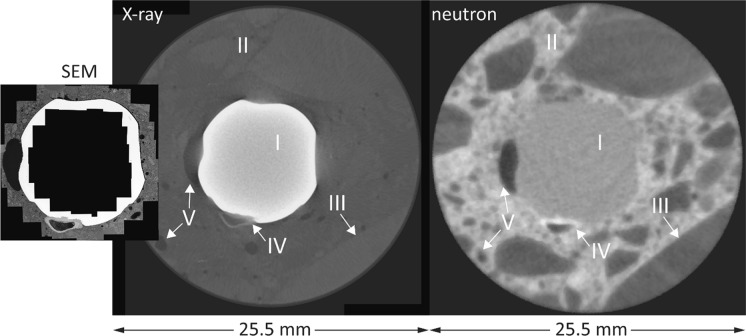
Fig. 3.
Comparison (at identical size and orientation) of cut and polished section viewed in SEM (stitched image) with the corresponding reconstructed sections from X-ray and neutron imaging modalities, illustrating the different specimen phases such as the rebar (I), cementitious phases (II), aggregates (III), corrosion products (IV), and voids (V). Note that through SEM only the steel–concrete interfacial region was imaged, while in both X-rays and neutron images the concrete matrix of the core is fully visible. To better observe the characteristics of the SCI as well as the occurrence of corrosion pits, the SEM micrograph with higher magnification is also visible in Fig. 8a. Note that the orientation of the reinforcement in the images may be different from the actual orientation of the steel when it was embedded in concrete, of which no information could be obtained

