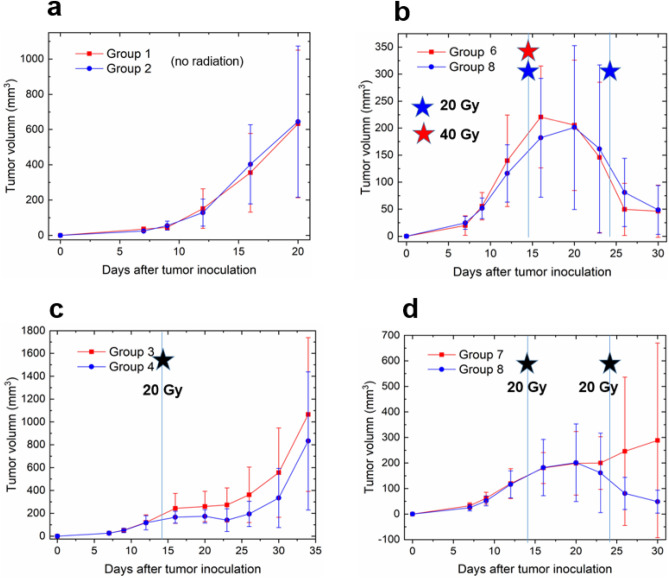
Figure 3.
Illustration of tumor volume measured under different delivery schemes according to Fig. 2b. The vertical line on day 14 represents the first radiation pulse. (a) Group 1 (isotype control) and group 2 (PD-L1 antibody, every other day), both without radiation applied. (b) Group 6 (a single pulse of 40 Gy) and group 8 (two pulses of 20 Gy separated by 10 days), both with PD-L1 antibody administered every other day. (c) Group 3 (control) and group 4 (PD-L1 antibody, every other day), both with a single pulse of 20 Gy delivered on day 14. (d). Group 7 (control) and group 8 (PD-L1, every other day), both with two pulses delivered with an interval of 10 days.

