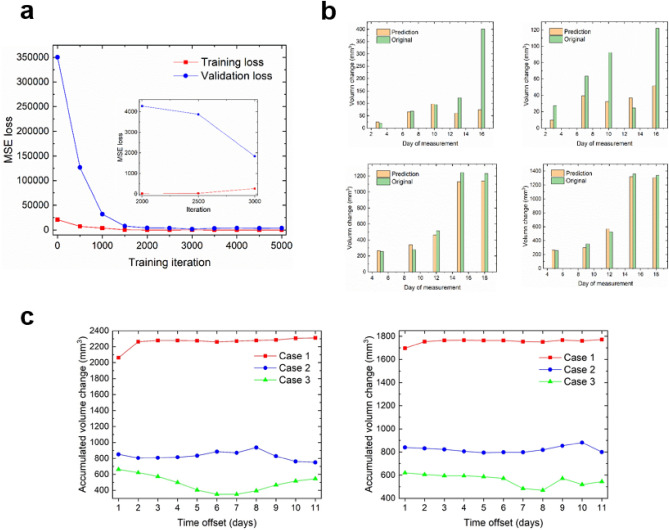
Figure 5.
(a) Training-loss and validation-loss curves in terms of mean squared error as a function of iteration. Details are shown in the zoom-in figure inset. (b) The results of validation for two cases, each case having two groups not included for training (top: groups 12 and 13, bottom: groups 11 and 14). The “original” volume change corresponds to the mean result of 50 samples within each group (after data augmentation). (c) The accumulated volume change (AVC) for new delivery schemes not included in the experimental study: case 1 (two pulses of 10 Gy, an interval of 10 days), case 2 (two pulses of 20 Gy, an interval of 10 days), and case 3 (a single pulse of 40 Gy). For all three cases, PD-L1 antibody was administered on either four (left panel) or two consecutive days (right panel), starting at different time offsets (in days) relative to the first radiation pulse.

