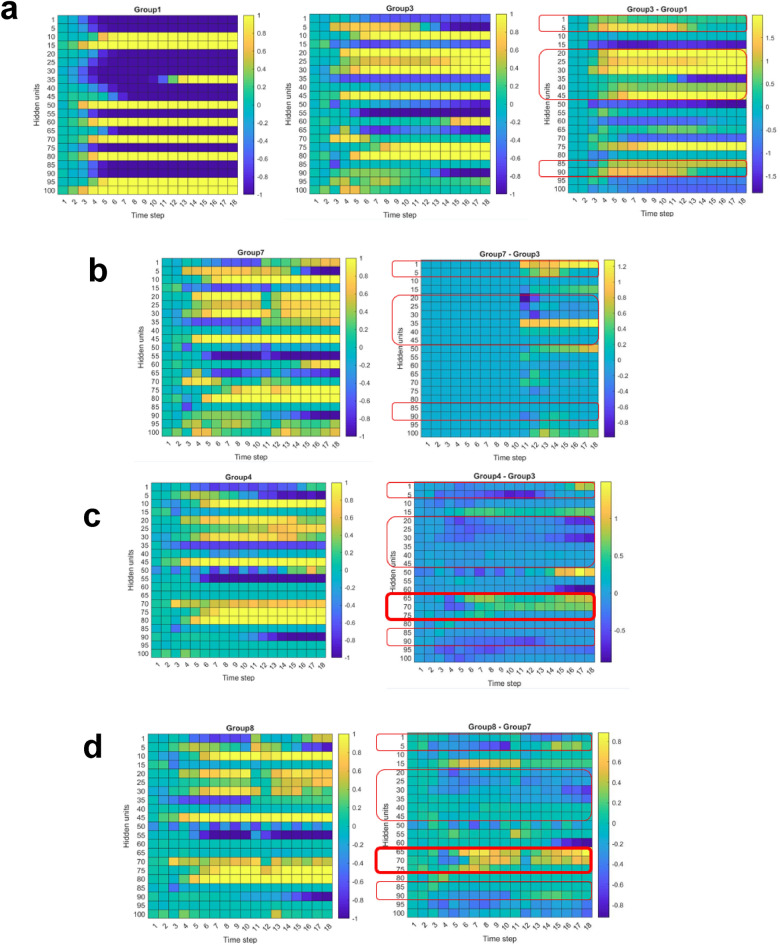
Figure 6.
Analyses of the maps of hidden units inside the LSTM-RNN model, which has 100 hidden units at each step and 18 steps in total. At each step, the tumor volume would be a linear combination of the values of 100 hidden units. The first time step on the horizontal axis corresponds to the day when the first anti-PD-L1 was administered. (a) Group 1 (isotype control) versus group 3 (20 Gy on day 3, isotype control). (b) Group 7 (20 Gy on day 3, 20 Gy on day 13, isotype control) vs. group 3. (c) Group 4 (20 Gy on day 3, anti-PD-L1) vs. group 3. (d) Group 8 (20 Gy on day 3, 20 Gy on day 13, anti-PD-L1) vs. group 7. We hypothesize that the difference between two groups, reveals the unique therapeutic effect attributable to either anti-PD-L1 or radiation. Three highlighted regions (vertical index: 1–5, 20–45, 85–90) correspond to radiation, while the fourth highlighted region (vertical index: 65–75, bold boundaries) corresponds to anti-PD-L1.

