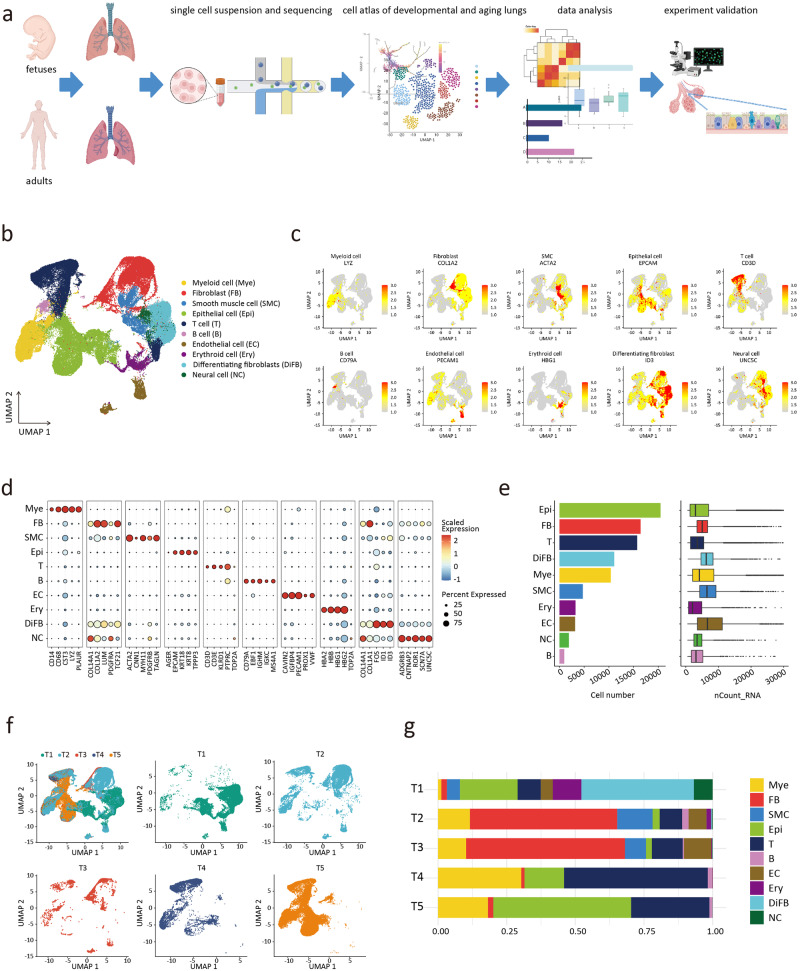
Fig. 1. A single-cell atlas of the developing and aging human lungs.
a Study flowchart. b UMAP plots showing the main cell cluster distribution of the developing and aging human lungs. c Expression of classical marker genes used to define the main cell clusters. d Dot plots showing the specific marker genes of the main cell clusters. e The number of cells of each main cell cluster. f UMAP plots showing the cell distribution in 5 phases. g For each of the 5 phases, the fraction of cells originating from each of the 10 main cell clusters.

